EURUSD
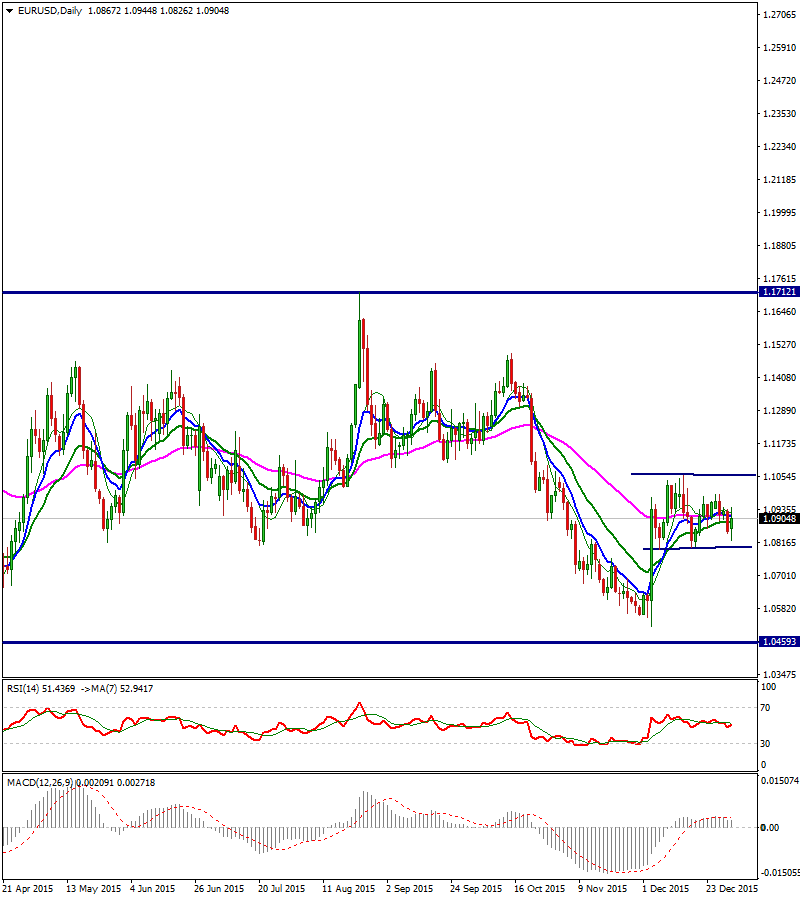
The Euro was down 10.28% against the US dollar in 2015, ending year under psychological 1.10 barrier. Low of the year 2015 at 1.0461, posted in March, remained intact, despite repeated attempts lower, which were contained just above 1.05 handle.
Weekly and monthly technicals remain bearish and favor further downside attempts, after completion of med-term consolidation, entrenched within 1.0461 and 1.1712 range, where the pair spent most of the time in 2015.
On the other side, daily studies gained bullish tone, on bounce from December’s low at 1.0519 and point at the upside.
Short-term price action is holding between 1.08 higher base and 1.1058, 15 Dec high, where recovery rally was capped by sideways-moving 200SMA.
These marks initial sup/res levels, with break of either side of the range, needed to define fresh direction.
Near-term price action entered daily Ichimoku cloud, base of which offers immediate support at 1.0830, guarding 1.08 pivot. Return below 1.08 higher base, would turn focus towards key supports at 1.0519 and 1.0461, lows of 03 Dec and 13 Mar 2015.
Otherwise, violation of strong resistances at 1.1030/60 zone, 200SMA / daily Ichimoku cloud top / 15 Dec recovery top, would open way for stronger recovery towards net barrier at 1.15 zone, lower top of mid-Oct and key barrier at 1.1712, high of 2015.
Res: 1.0990; 1.1030; 1.1060; 1.1120
Sup: 1.0800; 1.0720; 1.0645; 1.0520

GBPUSD
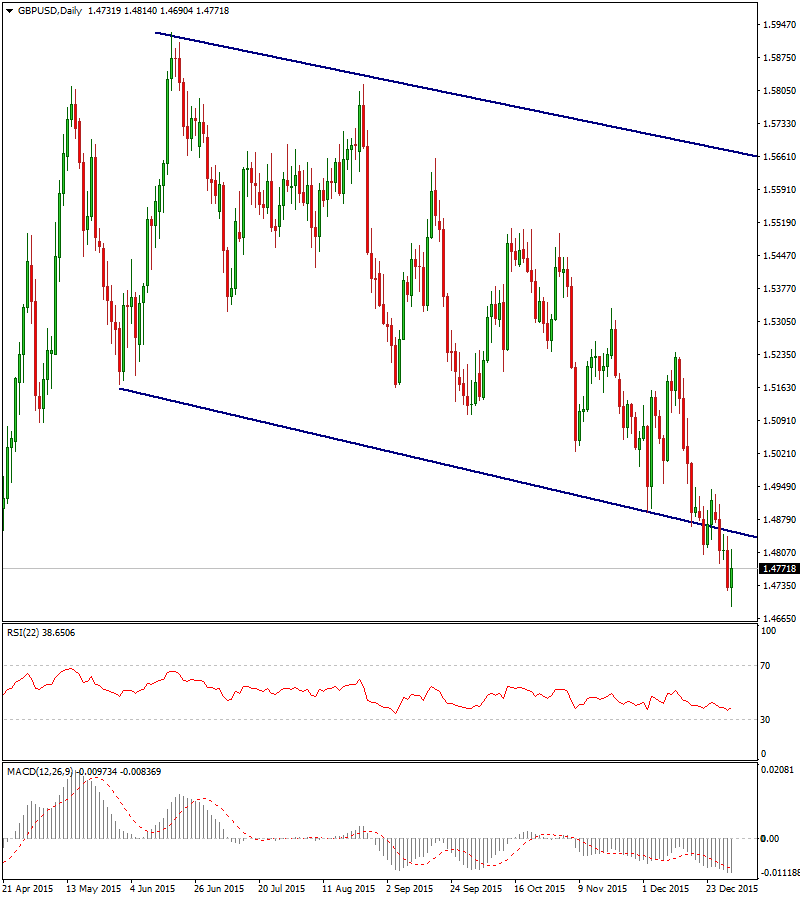
Cable is in strong downtrend since June 2015, following reversal of recovery rally from 1.4564, 2015 low, which stalled at 1.5928. Bearish acceleration broke below 1.4833, bear-channel support on the weekly chart and looks for full retracement of 1.4564/1.5928 rally.
Studies on larger timeframes hold firm bearish setup and keep downside in focus, with consolidation ahead of key 1.4564 support, expected on overextended daily indicators.
Falling daily 10SMA offers initial resistance at 1.4840, followed by 1.4900, Fibonacci 38.2% of 1.5237/1.4690 downleg and lower top of 24 Dec at 1.4943, where extended correction should be capped.
Only sustained break above psychological 1.50 barrier, would signal stronger correction and neutralize immediate downside threats.
Res: 1.4840; 1.4900; 1.5000; 1.5095
Sup: 1.4690; 1.4630; 1.4564; 1.4500

USDJPY
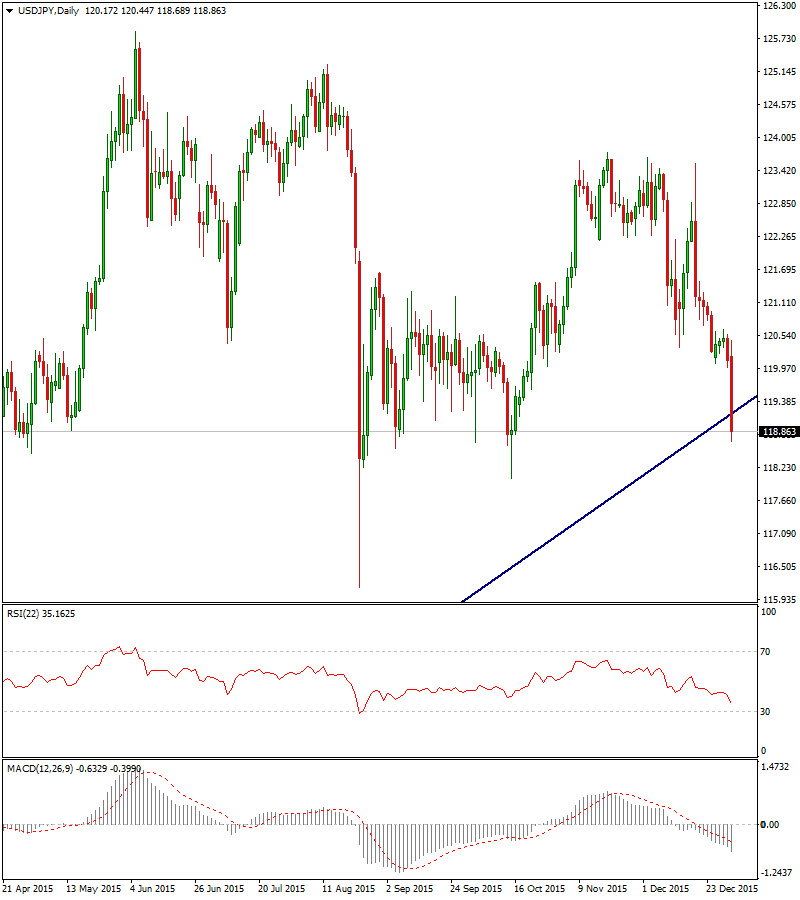
The pair traded within 115.80/125.85 congestion during the year 2015, after initial Jan / May rally stalled at 125.85 and subsequent pullback retraced over 61.8% of entire rally from 115.80, 2015 low.
Daily and weekly studies turned into bearish mode, on renewed weakness from 123.75, mid-Nov lower platform, heading towards initial support at 118.00, Feb/May base and 15 Oct low.
Violation of the latter will expose annual lows at 116/115.80 zone, which also mark the floor of year-long congestion and pivotal support zone, loss of which would signal stronger correction of broader ascend from 78.00 zone, lows of 2012.
Significant bearish signal was generated on break below, 119.76, multi-year bull-trendline, drawn off 78.00.
Psychological 120 level, offers initial resistance, ahead of lower top at 120.64, which guards daily Ichimoku cloud base at 120.89 and is expected to ideally cap rallies.
Double Death-Cross of 10/200 and 20/200SMA’s, confirms strong bearish pressure and marks the upper breakpoint at 121.60.
Res: 120.00; 120.65; 120.89; 121.60
Sup: 118.69; 118.00; 116.86; 116.00

AUDUSD
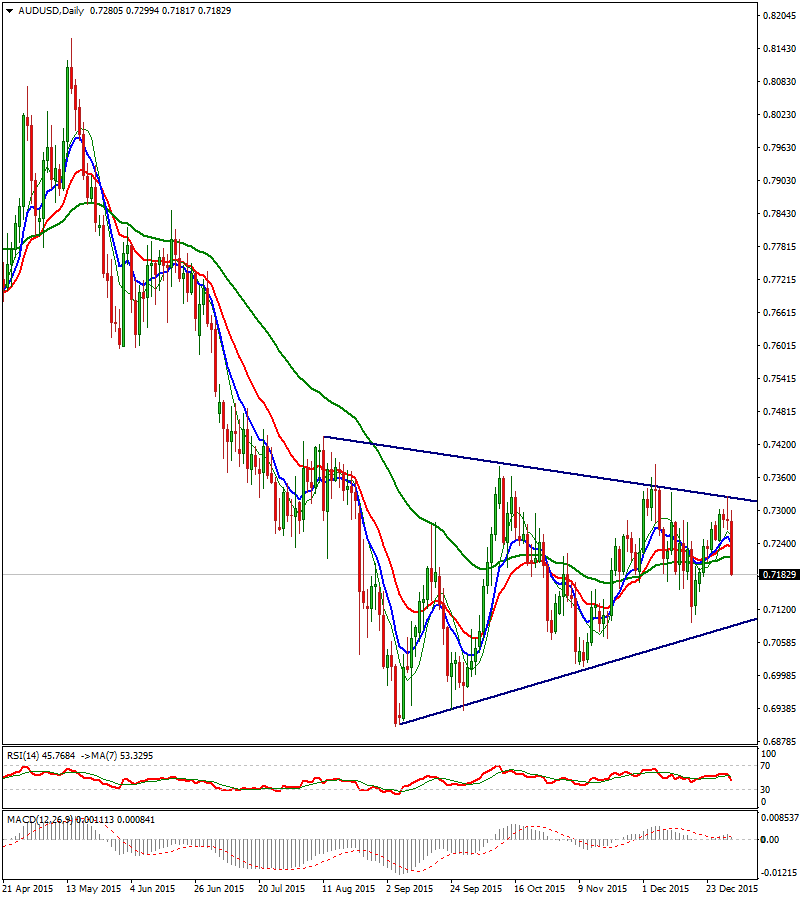
Aussie was down 11% from Jan 2015 high at 0.8180, to 0.6906, low of the year, posted in September. The pair trades in short-term consolidative phase above 0.6906 low, following sharp two-legged fall that commenced from 2014 high at 0.9443 and found temporary ground at 0.6906.
Consolidation is expected to precede fresh leg lower, extension of multi-year downtrend from 1.1079, peak of 2011.
Today’s fresh bearish acceleration, signals formation of lower top at 0.7325, 31 Dec high and shifts focus towards higher low of 17 Dec at 0.7095, loss of which to expose another pivot at 0.7014, higher low of 10 Nov.
Thin daily Ichimoku cloud en-route, should not mark serious obstacle for freshly established near-term bears.
On the daily chart, bullish alignment of technicals is losing traction, with violation of initial pivot at 0.7095, seen as trigger for further weakness, which would expose lower boundary of short-term congestion at 0.7014.
Firmly bearish weekly and monthly studies support scenario of limited upside action, ahead of fresh leg lower.
On the upside, top of recovery rally from 0.6906, at 0.7383, marks the upper breakpoint, above which, extended correction could be anticipated.
Res: 0.7232; 0.7299; 0.7325; 0.7383
Sup: 0.7153; 0.7095; 0.7014; 0.6936

The information contained in this document was obtained from sources believed to be reliable, but its accuracy or completeness cannot be guaranteed. Any opinions expressed herein are in good faith, but are subject to change without notice. No liability accepted whatsoever for any direct or consequential loss arising from the use of this document.
Recommended Content
Editors’ Picks
AUD/USD remained bid above 0.6500

AUD/USD extended further its bullish performance, advancing for the fourth session in a row on Thursday, although a sustainable breakout of the key 200-day SMA at 0.6526 still remain elusive.
EUR/USD faces a minor resistance near at 1.0750

EUR/USD quickly left behind Wednesday’s small downtick and resumed its uptrend north of 1.0700 the figure, always on the back of the persistent sell-off in the US Dollar ahead of key PCE data on Friday.
Gold holds around $2,330 after dismal US data

Gold fell below $2,320 in the early American session as US yields shot higher after the data showed a significant increase in the US GDP price deflator in Q1. With safe-haven flows dominating the markets, however, XAU/USD reversed its direction and rose above $2,340.
Bitcoin price continues to get rejected from $65K resistance as SEC delays decision on spot BTC ETF options

Bitcoin (BTC) price has markets in disarray, provoking a broader market crash as it slumped to the $62,000 range on Thursday. Meanwhile, reverberations from spot BTC exchange-traded funds (ETFs) continue to influence the market.
US economy: slower growth with stronger inflation

The dollar strengthened, and stocks fell after statistical data from the US. The focus was on the preliminary estimate of GDP for the first quarter. Annualised quarterly growth came in at just 1.6%, down from the 2.5% and 3.4% previously forecast.