Outlook:
While we were not paying attention, something called IHS Energy CERAWeek got going in Houston. We had to go look it up. The conference claims to be the 35th and “ranked among the top five ‘corporate leader’ conferences in the world” (ranked by whom?) The conference includes big shots from OPEC as well as US government officials like the Energy Secretary (who is probably the only Secretary since Rumsfeld you’d want to have a beer with).
We are most surprised that Vice-Chair Fischer will speak this evening. Wow. The guy in charge of global market stability in the same room with a bunch of Middle East oil ministers, not to mention the president of Mexico, the Canadian energy minister, the head of the IEA and slew of bigwigs from the oil companies.
Hardly anything ever comes out of these conference that the rest of us actually hear about. The real business gets done behind closed doors. But frayed nerves are on full display. Oil prices are actually fairly steady from day to day. Brent closed at $34.69 and is quoted this morning at $34.89. But oil market players saw a tiny intermediate dip as a reason to freak out. The FT notes that earlier, oil fell back to $34.12, or a 1.6% drop after a 5.1% gain on Monday that was due to the IEA seeing price stabilization in 2017. “West Texas Intermediate, the US marker, up 6.2 per cent at the start of the week, is off 2.2 per cent at $32.65.”
Wait a minute. Oil rose 5.1% on something forecasted to happen over a year out? And then retraced 1.6% of that silly gain? And WTI gave back one-third of the gain on the forecast. It’s still a net gain and it’s still based on a far-distant forecast. We say this is ridiculous—the gain is silly and the retracement is not abnormal. But we are paying attention to oil price gyrations because the correlation with equity indices is “an outstanding 0.76 so far this year,” according to Jefferies. “On two occasions when the WTI [US crude] price broke below the symbolic $30 level, we have seen quick recoveries.”
In addition to the price behavior, the conference is generating some new perspectives. OPEC chief El-Badri said of the US shale industry “I don’t know how we are going to live together. Any increase in the shale oil will come immediately and cover any reduction [by OPEC].” IEA chief Birol said drilling may be slowing, but will still hold back any price gains. “If prices rally, it will be capped by the US shale oil. This is something new.”
In other words, OPEC and the IEA admit what the US has been saying all along—the US is the swing producer. Are these comments perhaps a plea for the US producers to cooperate with the cartel? The mind boggles.
Birol even gives prices, saying oil could “recover to $80 a barrel by 2020, but a price above $60 would be enough for US production to grow. At a $60 oil price, a big chunk of the US shale oil [production] in six months of time may come back” (FT).
The conspiracy-theory gang is going to have a field day with this one. He’s practically begging for a back-room deal--“you can have $80 but you have to suppress production when the price gets over $60 in order for all of us to get the $80.” It’s brazen, to say the least. For North American producers to go along with this is probably illegal and also not consistent with the way the greedy oil guys have traditionally behaved, but you never know. Normally a big producer or two gangs up on smaller ones to take them over and it does this by driving prices down to the point of starvation.
With equity indices so closely linked to the oil price, you have to wonder whether the new orthodoxy is “higher oil prices are good for all.” This is really bad economics. Higher oil prices may be good for stock markets and thus the relatively wealthy, but hey! lower oil prices benefit consumers everywhere. We don’t know where this is going to go in the end. Let’s all listen to Mr. Fischer tonight. To be pragmatic, stabilizing oil prices are good for central banks, too. Central banks have been considering oil prices temporary, aberrant and outside their control, and therefore not something they pay much attention to. As we have written many times before, this is just plain stupid. Oil is critical to inflation expectations and any other forecast for the real economy. But we have yet to hear a Fed speak out in favor of privately-managed price controls. That’s what we will look for in Fischer’s comments.
Before Fischer, we get Minneapolis Fed Pres Kashkari and Dallas Fed Pres Kaplan speeches this morning. Kashkari is going to be fun. He has already come out with the view that the big banks need to be broken up and fiscal policy absolutely needs to be goosed—monetary policy can’t do the job alone. This is spitting in the ocean since Congress has refused to fund infrastructure projects, despite the bridges about to fall down.
We worry about the drop in yields across the curve when the US economy is not in bad shape. The conditions-sensitive 2-year is 0.766% this morning when it was over 1% only a few months ago. It seems like the fixed income market expects negative rates in the US, too, to match Japan and Europe, and is forcing the Fed to go there. The Fed did indeed include negative rates as an extreme crisis condition in the bank stress test set of scenarios, but it’s not as though the Fed actually expected such a thing. (In fact, it’s not clear the Fed has the mandate to go to negative rates, but that’s probably a legal hoo-ha.)
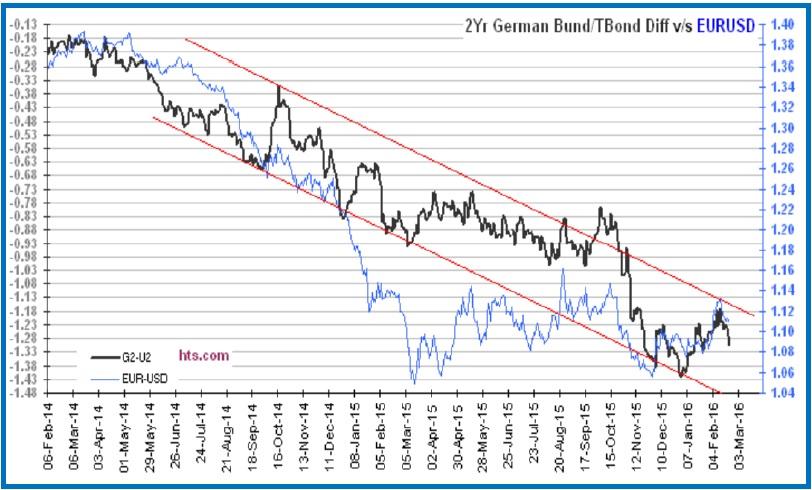
We look to yields for economic health and yields are telling a sad story. Yield differentials are telling some kind of story but we are not sure what it is. The US T-note/Bund yield differential is assumed to influence currency preference. Now we see a chart (for the 2-year) showing the euro fell more than the differential would have suggested. Since December, the differential has come back more in line with the euro/dollar, or vice versa (charts from http://www.kshitij.com/graphgallery/eurusddiff.shtml#eurusd).
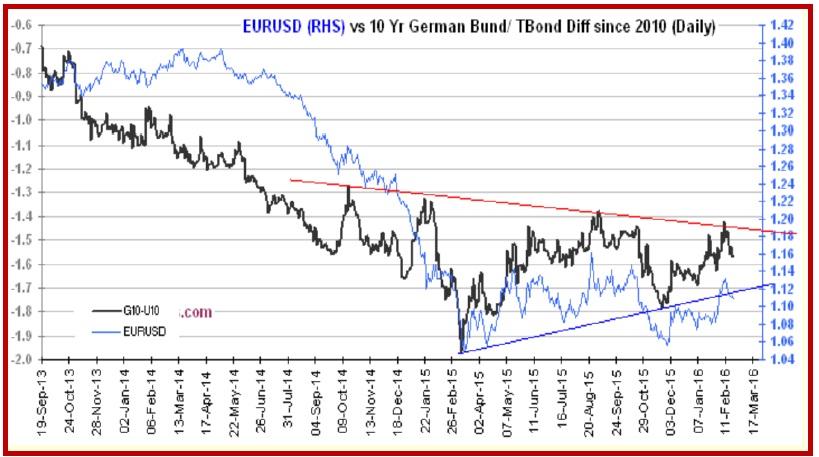
The 10-year diff shows the same thing—the euro diverging from the differential. Factors other than the differential count, of course, including expectations about ending QE in the US and starting QE in the eurozone. But these charts leave us with an uneasy feeling—they imply the euro is already oversold. Judging from activity so far this week, the differential is not on anyone’s mind—only what the ECB will do on March 10. We see the current downward trajectory of the euro as too steep and not sustainable. See the daily chart in the Chart Package. In Fibonacci terms, we are already at the 50% retracement of the move from the Dec low to the Feb high. The 62% retracement lies around 1.0850. This gives plenty of room for traders to keep adding to shorts, but it’s becoming an increasing unstable move because it is so extreme. Watch out.
| Current | Signal | Signal | Signal | |||
| Currency | Spot | Position | Strength | Date | Rate | Gain/Loss |
| USD/JPY | 111.94 | SHORT USD | STRONG | 02/04/16 | 117.57 | 4.79% |
| GBP/USD | 1.4094 | SHORT GBP | STRONG | 02/17/16 | 1.4349 | 1.78% |
| EUR/USD | 1.1011 | SHORT EURO | NEW*WEAK | 02/23/16 | 1.1011 | 0.00% |
| EUR/JPY | 123.27 | SHORT EURO | WEAK | 02/11/16 | 126.19 | 2.31% |
| EUR/GBP | 0.7812 | LONG EURO | WEAK | 10/23/15 | 0.7194 | 8.59% |
| USD/CHF | 0.9936 | SHORT USD | STRONG | 01/04/16 | 0.9979 | 0.43% |
| USD/CAD | 1.3745 | SHORT USD | STRONG | 02/01/16 | 1.4031 | 2.04% |
| NZD/USD | 0.6701 | LONG NZD | WEAK | 02/02/16 | 0.6486 | 3.31% |
| AUD/USD | 0.7243 | LONG AUD | STRONG | 01/25/16 | 0.6980 | 3.77% |
| AUD/JPY | 81.08 | SHORT AUD | WEAK | 02/11/16 | 78.47 | -3.33% |
| USD/MXN | 16.1208 | SHORT USD | NEW*WEAK | 02/23/16 | 16.1208 | 0.00% |
This morning FX briefing is an information service, not a trading system. All trade recommendations are included in the afternoon report.
Recommended Content
Editors’ Picks
AUD/USD hovers around 0.6500 amid light trading, ahead of US GDP

AUD/USD is trading close to 0.6500 in Asian trading on Thursday, lacking a clear directional impetus amid an Anzac Day holiday in Australia. Meanwhile, traders stay cautious due ti risk-aversion and ahead of the key US Q1 GDP release.
USD/JPY finds its highest bids since 1990, near 155.50

USD/JPY keeps breaking into its highest chart territory since June of 1990 early Thursday, testing 155.50 for the first time in 34 years as the Japanese Yen remains vulnerable, despite looming Japanese intervention risks. Focus shifts to Thursday's US GDP report and the BoJ decision on Friday.
Gold price lacks firm intraday direction, holds steady above $2,300 ahead of US data

Gold price remains confined in a narrow band for the second straight day on Thursday. Reduced Fed rate cut bets and a positive risk tone cap the upside for the commodity. Traders now await key US macro data before positioning for the near-term trajectory.
Injective price weakness persists despite over 5.9 million INJ tokens burned

Injective price is trading with a bearish bias, stuck in the lower section of the market range. The bearish outlook abounds despite the network's deflationary efforts to pump the price. Coupled with broader market gloom, INJ token’s doomed days may not be over yet.
Meta Platforms Earnings: META sinks 10% on lower Q2 revenue guidance Premium

This must be "opposites" week. While Doppelganger Tesla rode horrible misses on Tuesday to a double-digit rally, Meta Platforms produced impressive beats above Wall Street consensus after the close on Wednesday, only to watch the share price collapse by nearly 10%.

