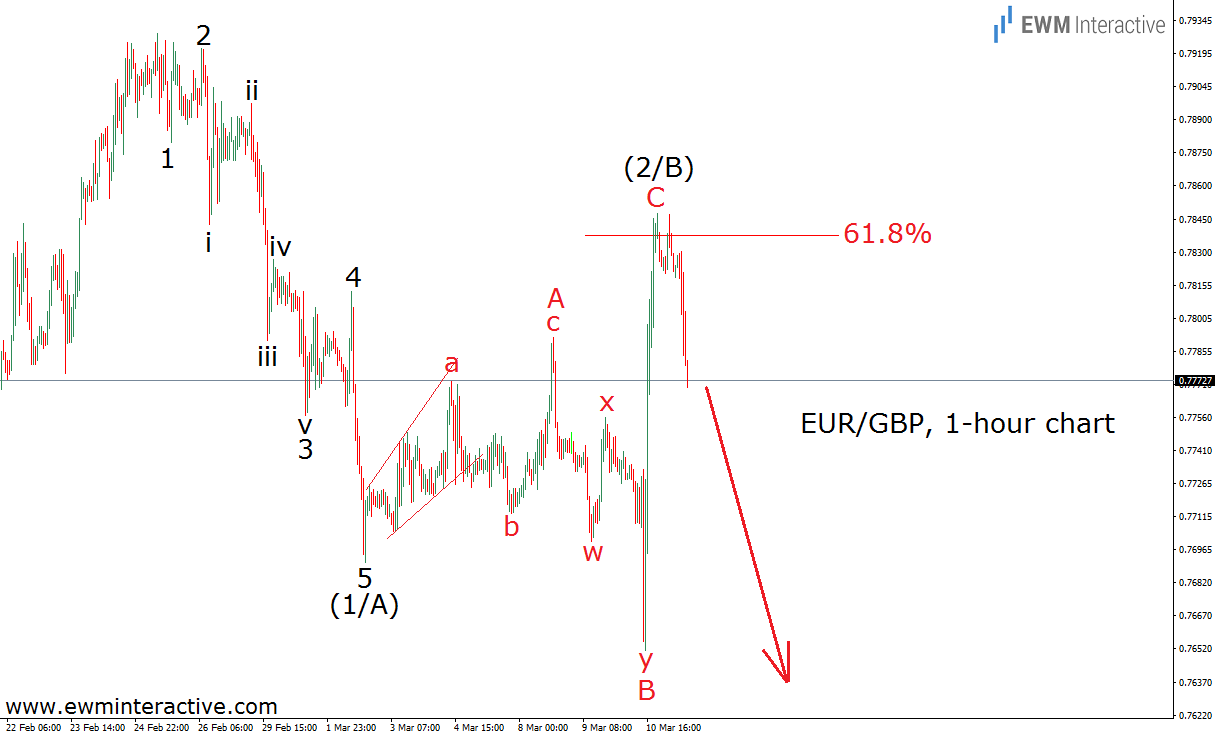
ECB’s policy decision produced fireworks in EURGBP on Thursday. The pair initially fell to 0.7651, but then rose sharply to 0.7848. Trouble is, this gives us no clue about what to expect from the pair next. Is it a “buy” or a “sell”? Fortunately, the Elliott Wave principle eliminates the “flip a coin” approach, by allowing us to analyse the price action and find patterns, indicating the most probable direction EURGBP is likely to choose.
The theory states that five-wave impulses move in the direction of the trend, while three-wave corrections develop against it. Therefore, once the correction is over, the trend resumes in the direction of the impulsive sequence. The hourly chart above shows how EURGBP has been developing since the top at 0.7928. It looks like the decline to 0.7690 could has a five-wave structure. So, the rest of the chart has to be the corresponding retracement, which seems to be an A-B-C expanding flat correction, where wave B makes a new low. Pay attention to the area where wave C seems to have ended – at the 61.8% Fibonacci level of the previous impulse.
If this is the correct count, EURGBP could be expected to decline below 0.7650, while 0.7850 is not supposed to be bothered any time soon. In conclusion, the powerful leap EURGBP made yesterday was quite impressive, but the Wave principle suggests all of those gains are likely to be erased.
Trading financial instruments entails a great degree of uncertainty and a variety of risks. EMW Interactive’s materials and market analysis are provided for educational purposes only. As such, their main purpose is to illustrate how the Elliott Wave Principle can be applied to predict movements in the financial markets. As a perfectly accurate method for technical analysis does not exist, the Elliott Wave Principle is also not flawless. As a result, the company does not take any responsibility for the potential losses our end-user might incur. Simply, any decision to trade or invest, based on the information from this website, is at your own risk.
Recommended Content
Editors’ Picks
AUD/USD remained bid above 0.6500

AUD/USD extended further its bullish performance, advancing for the fourth session in a row on Thursday, although a sustainable breakout of the key 200-day SMA at 0.6526 still remain elusive.
EUR/USD faces a minor resistance near at 1.0750

EUR/USD quickly left behind Wednesday’s small downtick and resumed its uptrend north of 1.0700 the figure, always on the back of the persistent sell-off in the US Dollar ahead of key PCE data on Friday.
Gold holds around $2,330 after dismal US data

Gold fell below $2,320 in the early American session as US yields shot higher after the data showed a significant increase in the US GDP price deflator in Q1. With safe-haven flows dominating the markets, however, XAU/USD reversed its direction and rose above $2,340.
Bitcoin price continues to get rejected from $65K resistance as SEC delays decision on spot BTC ETF options

Bitcoin (BTC) price has markets in disarray, provoking a broader market crash as it slumped to the $62,000 range on Thursday. Meanwhile, reverberations from spot BTC exchange-traded funds (ETFs) continue to influence the market.
US economy: slower growth with stronger inflation

The dollar strengthened, and stocks fell after statistical data from the US. The focus was on the preliminary estimate of GDP for the first quarter. Annualised quarterly growth came in at just 1.6%, down from the 2.5% and 3.4% previously forecast.
