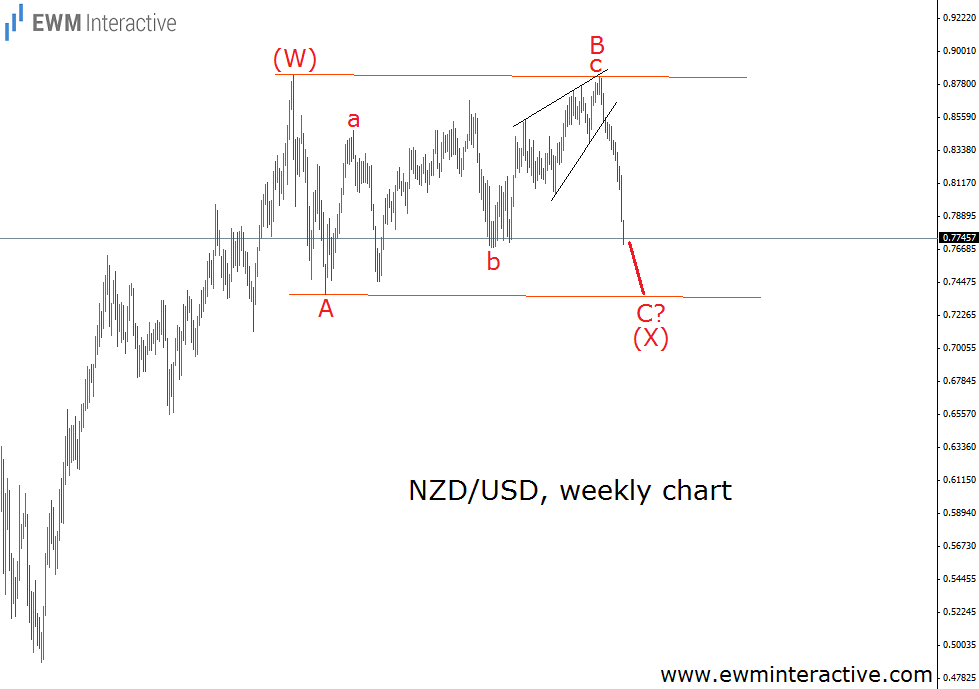
It’s been 7 months since we published “NZDUSD Approaching a Major Resistance” on June 30th, 2014. The forecast assumed NZDUSD is getting close to the point of reversal, somewhere in the 0.88 – 0.89 area. This is the chart we used to make this assumption:
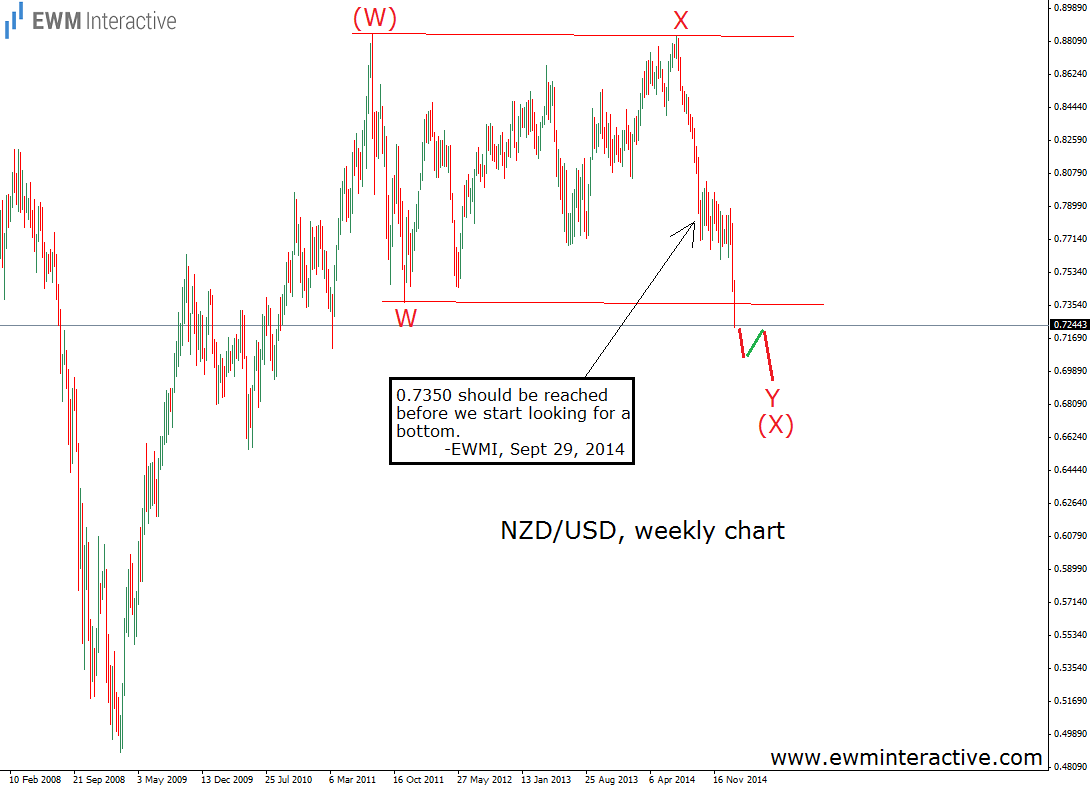
Soon after that, the pair topped at 0.8835 on July 11th and started declining. Some 11 cents lower we published an update. The following chart gave an idea of where to place our minimum targets: “0.7350 should be reached before we start looking for a bottom.”
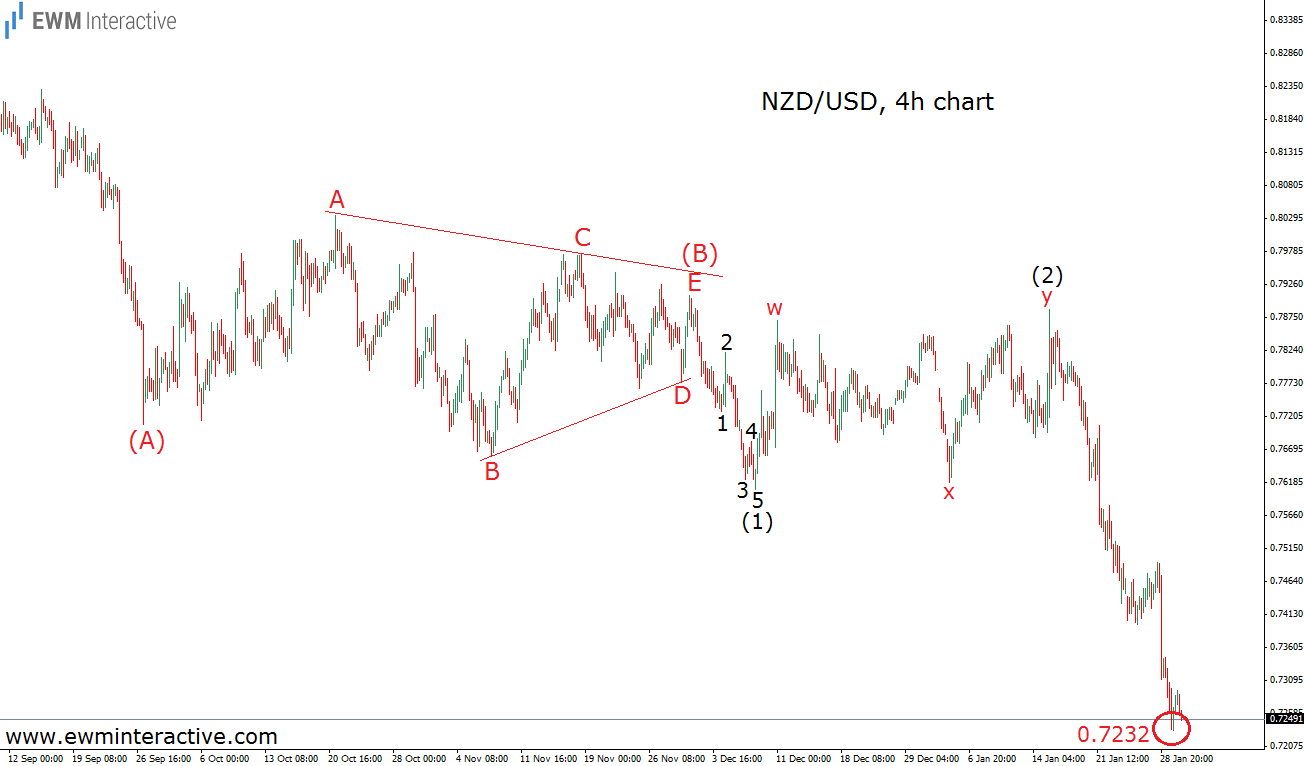
In other words, we were expecting at least 400 more pips to the south. Unfortunately, the market decided to put things off for a while. The zone between 0.77 and 0.80 offered nothing but sideways movement. This brought us to the idea of a triangle correction in progress, so on December 4th, 2014, we provided you with an update, called “NZDUSD And The Lack of Direction”. The chart below shows NZDUSD as it was almost two months ago.
As visible, the Elliott Wave Principle suggested we should expect another sell-off in the face of wave (C), as soon as this wave (B) triangle is finished. Yesterday, January 29th, 2015, the New Zealand dollar fell to 0.7232 against the US dollar, thus reaching some 120 pips beyond the minimum target of 0.7350.
However, there are still no signs of reversal. In fact, we think NZDUSD is still somewhere in the middle of wave 3 of (C). This means we should expect lower levels, because waves 4 and 5 of (C) of Y need to be completed, before the whole W-X-Y pattern is over. Here is how this looks on the big picture:
It seems there is still room for more weakness. If this analysis is correct, we should not be surprised to see NZDUSD touching the 0.70 mark. Stay tuned for further updates and do not forget to share your thoughts with us in the comment section below.
Trading financial instruments entails a great degree of uncertainty and a variety of risks. EMW Interactive’s materials and market analysis are provided for educational purposes only. As such, their main purpose is to illustrate how the Elliott Wave Principle can be applied to predict movements in the financial markets. As a perfectly accurate method for technical analysis does not exist, the Elliott Wave Principle is also not flawless. As a result, the company does not take any responsibility for the potential losses our end-user might incur. Simply, any decision to trade or invest, based on the information from this website, is at your own risk.
Recommended Content
Editors’ Picks
EUR/USD regains traction, recovers above 1.0700

EUR/USD regained its traction and turned positive on the day above 1.0700 in the American session. The US Dollar struggles to preserve its strength after the data from the US showed that the economy grew at a softer pace than expected in Q1.
GBP/USD returns to 1.2500 area in volatile session

GBP/USD reversed its direction and recovered to 1.2500 after falling to the 1.2450 area earlier in the day. Although markets remain risk-averse, the US Dollar struggles to find demand following the disappointing GDP data.
Gold climbs above $2,340 following earlier drop

Gold fell below $2,320 in the early American session as US yields shot higher after the data showed a significant increase in the US GDP price deflator in Q1. With safe-haven flows dominating the markets, however, XAU/USD reversed its direction and rose above $2,340.
XRP extends its decline, crypto experts comment on Ripple stablecoin and benefits for XRP Ledger

Ripple extends decline to $0.52 on Thursday, wipes out weekly gains. Crypto expert asks Ripple CTO how the stablecoin will benefit the XRP Ledger and native token XRP.
After the US close, it’s the Tokyo CPI

After the US close, it’s the Tokyo CPI, a reliable indicator of the national number and then the BoJ policy announcement. Tokyo CPI ex food and energy in Japan was a rise to 2.90% in March from 2.50%.


