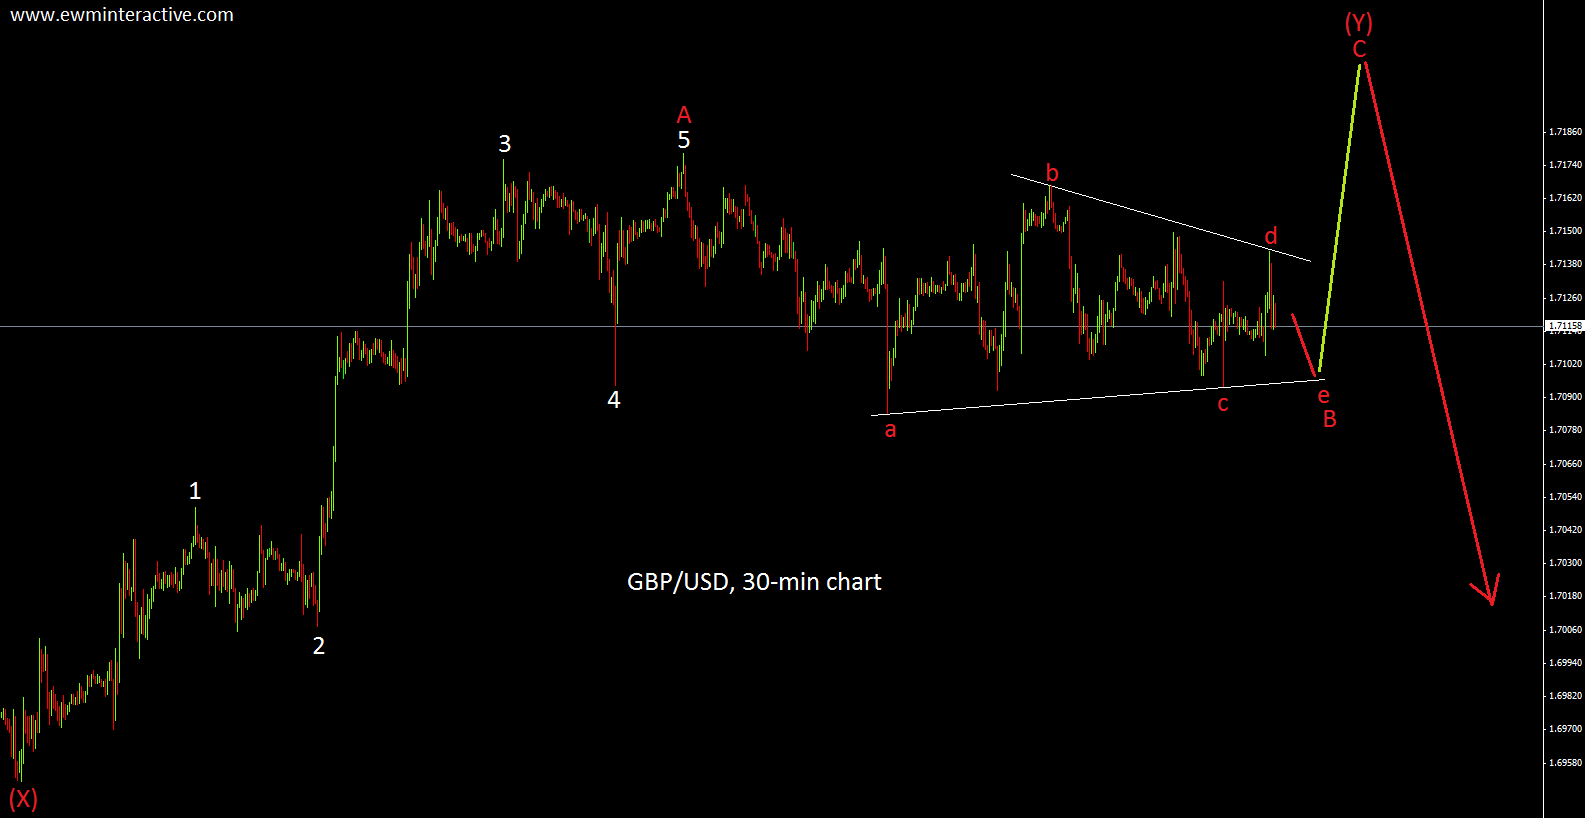
On July 14th we published an intraday analysis of GBPUSD, titled “GBPUSD with one last move to the north”. In that piece of material we were expecting a thrust in wave C to the upside from a presumed wave B triangle. “Once the triangle is finished, we will be expecting GBPUSD to reach 1.7200 in wave C. GBPUSD should not go above 1.7225″ These assumptions were based on the chart below.
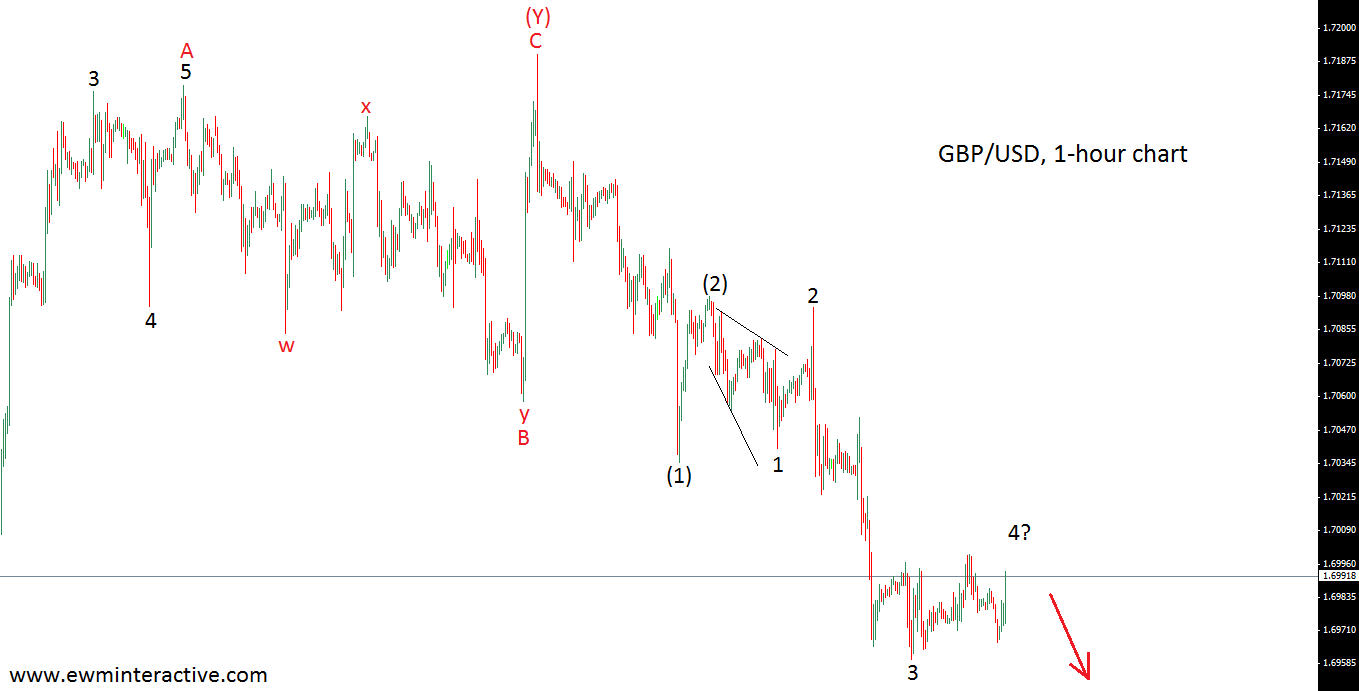
Now, 15 days later, we can say that the triangle failed, but the rest of the forecast went quite well. Instead of a triangle, wave B developed as a double zig-zag labeled w-x-y. When it was completed, GBPUSD resumed its uptrend, leading prices as high as 1.7190. Once this level was reached, the pair started declining just as we expected and is now trading below 1.70. The next chart will visualize all these explanations for you.
In conclusion, GBPUSD has been going according to plan so far. Furthermore, prices did not reach 1.7225, which means that our big picture scenario remains valid.
Trading financial instruments entails a great degree of uncertainty and a variety of risks. EMW Interactive’s materials and market analysis are provided for educational purposes only. As such, their main purpose is to illustrate how the Elliott Wave Principle can be applied to predict movements in the financial markets. As a perfectly accurate method for technical analysis does not exist, the Elliott Wave Principle is also not flawless. As a result, the company does not take any responsibility for the potential losses our end-user might incur. Simply, any decision to trade or invest, based on the information from this website, is at your own risk.
Recommended Content
Editors’ Picks
EUR/USD clings to gains near 1.0700, awaits key US data

EUR/USD clings to gains near the 1.0700 level in early Europe on Thursday. Renewed US Dollar weakness offsets the risk-off market environment, supporting the pair ahead of the key US GDP and PCE inflation data.
USD/JPY keeps pushing higher, eyes 156.00 ahead of US GDP data

USD/JPY keeps breaking into its highest chart territory since June of 1990 early Thursday, recapturing 155.50 for the first time in 34 years as the Japanese Yen remains vulnerable, despite looming intervention risks. The focus shifts to Thursday's US GDP report and the BoJ decision on Friday.
Gold closes below key $2,318 support, US GDP holds the key

Gold price is breathing a sigh of relief early Thursday after testing offers near $2,315 once again. Broad risk-aversion seems to be helping Gold find a floor, as traders refrain from placing any fresh directional bets on the bright metal ahead of the preliminary reading of the US first-quarter GDP due later on Thursday.
Injective price weakness persists despite over 5.9 million INJ tokens burned

Injective price is trading with a bearish bias, stuck in the lower section of the market range. The bearish outlook abounds despite the network's deflationary efforts to pump the price.
Meta takes a guidance slide amidst the battle between yields and earnings

Meta's disappointing outlook cast doubt on whether the market's enthusiasm for artificial intelligence. Investors now brace for significant macroeconomic challenges ahead, particularly with the release of first-quarter GDP data.

