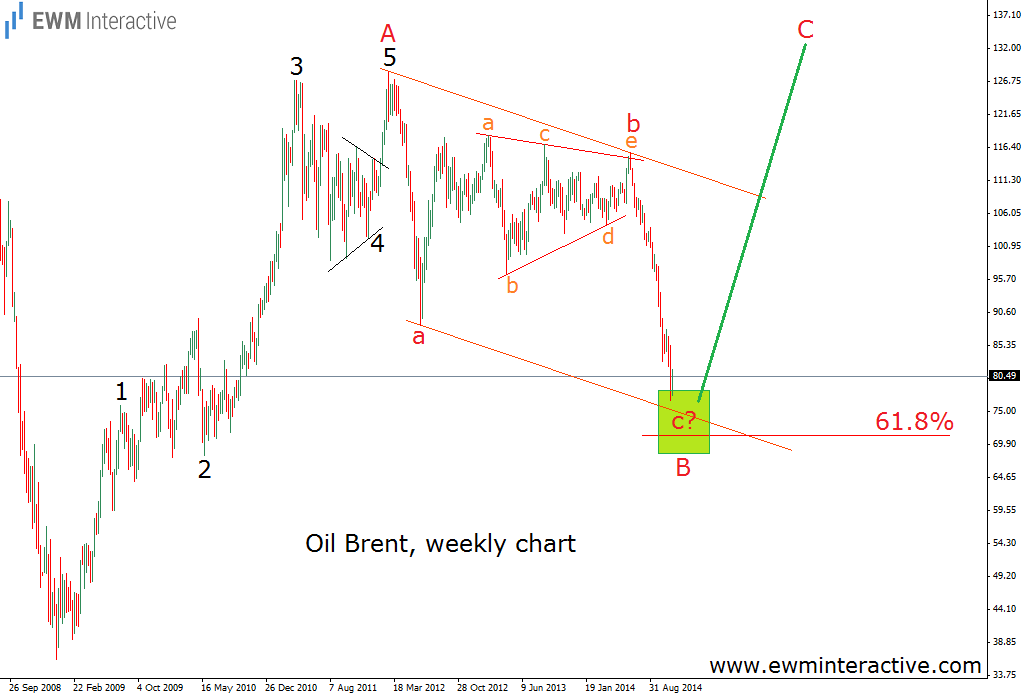
Brent Oil has been declining sharply during the last five months, falling down from above $115 per barrel in June to under $77 in November. It may seem the sell-off will last forever, but the Elliott Wave Principle gives us the right to disagree. It states that every price move, regardless of how big, is just one wave of a larger patterned cycle. So, where does this 38-dollar slump fit into the bigger picture? In order to find the answer, we have to look at a large enough time-frame chart, such as weekly.
According to the theory, the five-wave impulse shows the direction of the larger trend. Every impulse is followed by a three-wave correction in the opposite direction. The chart shows, that after the crash of 2008 there is one such impulse from $36 to $128. We will label it “A”. This means that all that happened after the $128 peak should be the natural three-wave retracement. And it really looks like oil brent has drawn an a-b-c zig-zag corrective pattern, where wave “b” is a triangle. Triangles precede the last move of the larger sequence. Here, the larger sequence is the a-b-c zig-zag and the last move is wave “c”, which is currently in progress. If this is the correct count, wave “c” of B should be expected to end somewhere in the zone of the 61.8% Fibonacci level. Then the 5-3 Elliott Wave cycle would be completed and the uptrend could resume in the face of wave C. It may seem impossible now, but if this count is right, brent oil could reach the $130 mark in the next two or three years.
Trading financial instruments entails a great degree of uncertainty and a variety of risks. EMW Interactive’s materials and market analysis are provided for educational purposes only. As such, their main purpose is to illustrate how the Elliott Wave Principle can be applied to predict movements in the financial markets. As a perfectly accurate method for technical analysis does not exist, the Elliott Wave Principle is also not flawless. As a result, the company does not take any responsibility for the potential losses our end-user might incur. Simply, any decision to trade or invest, based on the information from this website, is at your own risk.
Recommended Content
Editors’ Picks
EUR/USD climbs to 10-day highs above 1.0700

EUR/USD gained traction and rose to its highest level in over a week above 1.0700 in the American session on Tuesday. The renewed US Dollar weakness following the disappointing PMI data helps the pair stretch higher.
GBP/USD extends recovery beyond 1.2400 on broad USD weakness

GBP/USD gathered bullish momentum and extended its daily rebound toward 1.2450 in the second half of the day. The US Dollar came under heavy selling pressure after weaker-than-forecast PMI data and fueled the pair's rally.
Gold rebounds to $2,320 as US yields turn south

Gold reversed its direction and rose to the $2,320 area, erasing a large portion of its daily losses in the process. The benchmark 10-year US Treasury bond yield stays in the red below 4.6% following the weak US PMI data and supports XAU/USD.
Here’s why Ondo price hit new ATH amid bearish market outlook Premium

Ondo price shows no signs of slowing down after setting up an all-time high (ATH) at $1.05 on March 31. This development is likely to be followed by a correction and ATH but not necessarily in that order.
Germany’s economic come back

Germany is the sick man of Europe no more. Thanks to its service sector, it now appears that it will exit recession, and the economic future could be bright. The PMI data for April surprised on the upside for Germany, led by the service sector.
