![]() Nick Mastrandrea
Nick Mastrandrea
Market Tea Leaves
Good Morning Traders,
As of this writing 4:30 AM EST, here’s what we see:
US Dollar: Up at 94.910 the US Dollar is up 2 ticks and trading at 94.910.
Energies: May Crude is down at 41.38.
Financials: The June 30 year bond is up 7 ticks and trading at 165.17.
Indices: The June S&P 500 emini ES contract is down 11 ticks and trading at 2073.75.
Gold: The June gold contract is trading up at 1232.30. Gold is 58 ticks higher than its close. Initial Conclusion
This is not a correlated market. The dollar is up+ and crude is down- which is normal and the 30 year bond is trading higher. The Financials should always correlate with the US dollar such that if the dollar is lower then bonds should follow and vice-versa. The indices are down and Crude is trading lower which is not correlated. Gold is trading up which is not correlated with the US dollar trading up. I tend to believe that Gold has an inverse relationship with the US Dollar as when the US Dollar is down, Gold tends to rise in value and vice-versa. Think of it as a seesaw, when one is up the other should be down. I point this out to you to make you aware that when we don’t have a correlated market, it means something is wrong. As traders you need to be aware of this and proceed with your eyes wide open.
Asia traded mixed with half the exchanges trading higher and the other half lower. As of this writing all of Europe is trading lower.
Possible Challenges To Traders Today
- Empire State Manufacturing Index is out at 8:30 AM EST. This is major.
- Capacity Utilization Rate is out at 9:15 AM EST. This is major.
- Industrial Production m/m is out at 9:15 AM EST. This is major.
- Prelim UoM Consumer Sentiment is out at 10 AM EST. This is major.
- Prelim UoM Inflation Expectations is out at 10 AM EST. This is major.
- TIC Long-Term Purchases is out at 4 PM EST. This is not major.
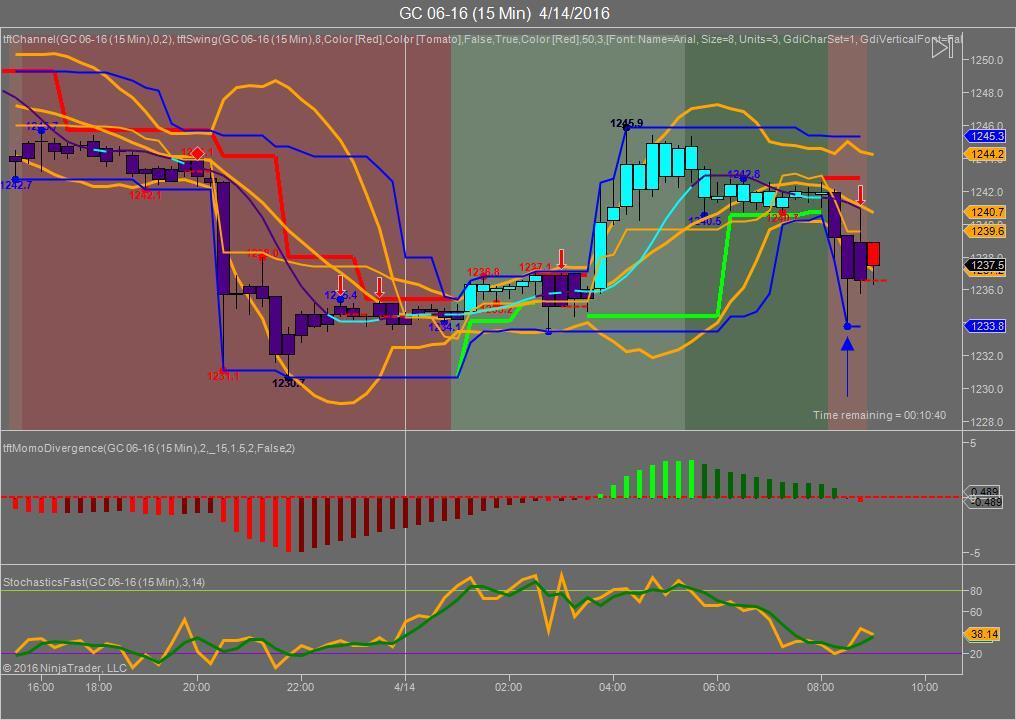
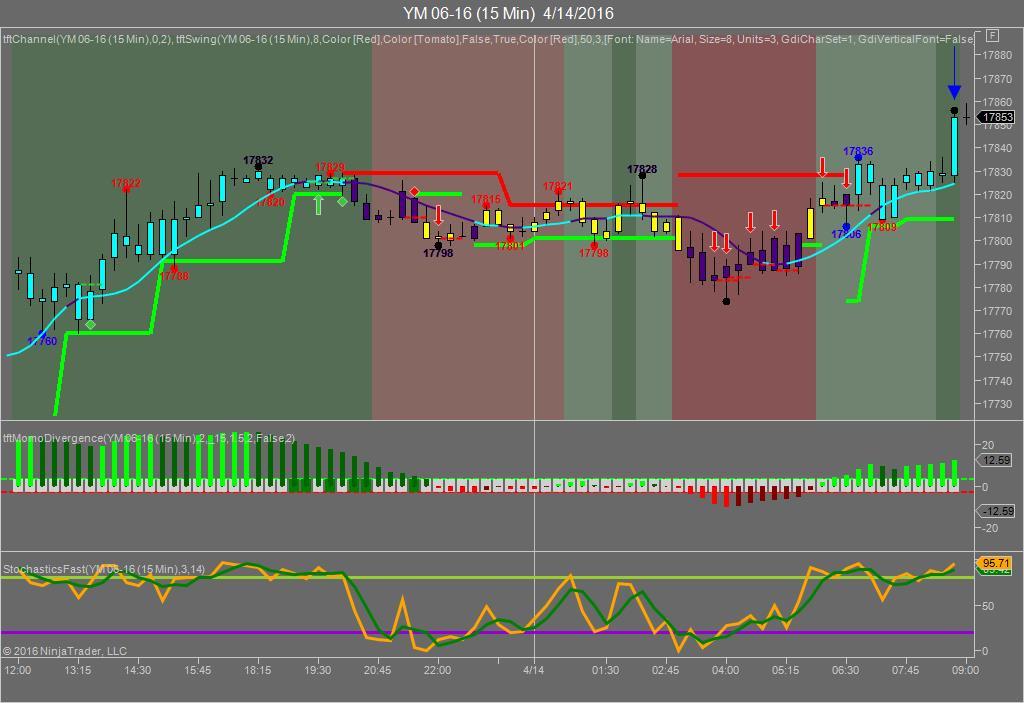
Gold
We’ve elected to switch gears a bit and show correlation between Gold and The YM futures contract. The YM contract is the DJIA and the purpose is to show reverse correlation between the two instruments. Remember it’s liken to a seesaw, when up goes up the other should go down and vice versa.
Yesterday Gold made it’s move at around 8:45 AM EST after the Unemployment Claims came out. The YM hit a high at around that time and Gold hit a low. If you look at the charts below the YM gave a signal at around 8:45 AM EST, while Gold also gave a signal at just about the same time. Look at the charts below and you’ll see a pattern for both assets. The YM hit a high at around 8:45 AM EST and Gold hit a low. These charts represent the latest version of Trend Following Trades and I’ve changed the timeframe to a 15 minute chart to display better. This represented a long opportunity on Gold, as a trader you could have netted 30-40 plus ticks per contract on this trade. Each tick is worth $10. We added a Donchian Channel to the charts to show the signals more clearly.
Charts Courtesy of Trend Following Trades built on a NinjaTrader platform
Bias
Yesterday we gave the markets an downside bias as both the USD and the Bonds were trading higher and that usually doesn’t bode well for an upside day. The Dow closed 18 points higher, the Nasdaq closed down 2 points and the S&P up 1 point. Today we aren’t dealing with a correlated market and our bias is to the downside.
Could this change? Of Course. Remember anything can happen in a volatile market.
Commentary
Yesterday we gave the markets a downside bias as both the Bonds and USD were trading higher. CPI numbers came out at 8:30 AM EST that did not meet expectation and in this case that a good sign because if CPI were higher and considered “runaway” the Fed would be compelled to hike rates. CPI came in at 0.1% versus 0.2% expected which is one tenth of 1 percent and that is nothing. The good news here is the Fed won’t be compelled to raise rates any time soon. Today we have the Empire State Manufacturing Index number out at 8:30 AM EST and this is a good indication as to how manufacturing is doing in the US.
Trading performance displayed herein is hypothetical. The following Commodity Futures Trading Commission (CFTC) disclaimer should be noted.
Hypothetical performance results have many inherent limitations, some of which are described below. No representation is being made that any account will or is likely to achieve profits or losses similar to those shown.
In fact, there are frequently sharp differences between hypothetical performance results and the actual results subsequently achieved by any particular trading program. One of the limitations of hypothetical performance trading results is that they are generally prepared with the benefit of hindsight.
In addition, hypothetical trading does not involve financial risk, and no hypothetical trading record can completely account for the impact of financial risk in actual trading. For example, the ability to withstand losses or to adhere to a particular trading program in spite of trading losses are material points which can also adversely affect actual trading results.
There are numerous other factors related to the markets in general or to the implementation of any specific trading program which cannot be fully accounted for in the preparation of hypothetical performance results and all of which can adversely affect actual trading results.
Trading in the commodities markets involves substantial risk and YOU CAN LOSE A LOT OF MONEY, and thus is not appropriate for everyone. You should carefully consider your financial condition before trading in these markets, and only risk capital should be used.
In addition, these markets are often liquid, making it difficult to execute orders at desired prices. Also, during periods of extreme volatility, trading in these markets may be halted due to so-called “circuit breakers” put in place by the CME to alleviate such volatility. In the event of a trading halt, it may be difficult or impossible to exit a losing position.
Recommended Content
Editors’ Picks
AUD/USD pressures as Fed officials hold firm on rate policy

The Australian Dollar is on the defensive against the US Dollar, as Friday’s Asian session commences. On Thursday, the antipodean clocked losses of 0.21% against its counterpart, driven by Fed officials emphasizing they’re in no rush to ease policy. The AUD/USD trades around 0.6419.
EUR/USD extends its downside below 1.0650 on hawkish Fed remarks

The EUR/USD extends its downside around 1.0640 after retreating from weekly peaks of 1.0690 on Friday during the early Asian session. The hawkish comments from Federal Reserve officials provide some support to the US Dollar.
Gold price edges higher on risk-off mood hawkish Fed signals

Gold prices advanced late in the North American session on Thursday, underpinned by heightened geopolitical risks involving Iran and Israel. Federal Reserve officials delivered hawkish messages, triggering a jump in US Treasury yields, which boosted the Greenback.
Bitcoin Price Outlook: All eyes on BTC as CNN calls halving the ‘World Cup for Bitcoin’

Bitcoin price remains the focus of traders and investors ahead of the halving, which is an important event expected to kick off the next bull market. Amid conflicting forecasts from analysts, an international media site has lauded the halving and what it means for the industry.
Is the Biden administration trying to destroy the Dollar?

Confidence in Western financial markets has already been shaken enough by the 20% devaluation of the dollar over the last few years. But now the European Commission wants to hand Ukraine $300 billion seized from Russia.