![]() Andre Gratian
Andre Gratian
Market Turning Points
"By the Law of Periodical Repetition, everything which has happened once must happen again, and again, and again -- and not capriciously, but at regular periods, and each thing in its own period, not another's, and each obeying its own law... The same Nature which delights in periodical repetition in the sky is the Nature which orders the affairs of the earth. Let us not underrate the value of that hint." ~ Mark Twain
Current Position of the Market
SPX Long-term trend: The beginning of a lengthy correction is probably underway!
SPX Intermediate trend: Potential rally top.
Analysis of the short-term trend is done on a daily basis with the help of hourly charts. It is an important adjunct to the analysis of daily and weekly charts which discuss longer market trends.
Market Overview
After reachingthe stated P&F price projection for the two-month rally which began at 1810, SPX started a minor decline which, so far, has retraced some 40 points and has found support at 2043, an important price level which was breached but not broken. Since the correction does not appear to be over, it is likely that, over the next few days, it will be and that the next important support of 2020 will be challenged. That could be the extent of this correction which, in all likelihood, is the beginning of a distribution process taking place before the primary trend --that is currently sideways but should eventually turn into a more severe decline – resumes. This is an assumption which is based on an analysis of market performance, historical patterns, cycles, etc.
When the current correction has ended, the SPX will have a chance to prove us wrong, and some of the weekly price and breadth indicators will have to weaken sufficiently over the near future to show that our presumption is valid. The price pattern of the past few days looks more like a consolidation in an uptrend, but that could change if the decline breaks below the 2043 support steepens. Even so, the next rally is likely to retest the recent high which not only filled a P&F projection, but also encountered heavy overhead resistance. The outcome of that test will give us more information about the market’s longer-term position. The last intermediate top took nearly two months to form. We may be ready to do something similar.
SPX Chart Analysis
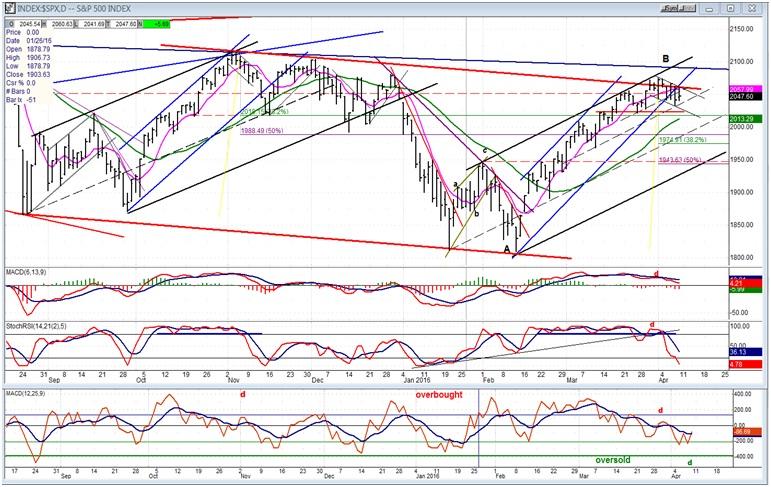
Daily chart (This chart, and others below, are courtesy of QCharts.com.)
I have pointed out the similarity of the two rallies. Will it continue? After topping, the October rally retraced .382 of its uptrend, reversed and made a slightly lower high, declined again (this time to the 50% retracement level) rallied again briefly to another lower high, and finally started a downtrend in earnest. If the current pattern continues to mimic the former, an initial decline to 1974 (.382 retracement) would take place. Actually, there is P&F distribution pattern which has formed above 2020 which has enough of a count to extend the decline to that level. The potential is there, but will it be realized?
The first clue would be if an acceleration of the decline begins next week, breaks below 2043 decisively and, after a brief hold at the 2020 level, continues lower with increasingly negative A/Ds. Considering the state of the weekly indicators, this may be a tall order! Technically, Friday was a strange day with strong A/Ds and weak price. The opening gap was underscored by very strong breadth which lingered near its high for some time and gave ground reluctantly as SPX retraced its entire 15-point advance (and more) before rallying into the close. The opening strength was primarily reflected in the broad-based NYSE index which outperformed the SPX by a good margin for the day. At the same time, the NDX was relatively weaker than SPX, remaining negative for most of the day, and closing with a loss. A strong opening by oil was responsible for the initial market strength, and it retained its opening gain into the close. It also looks capable of extending this gain, possibly to a new short-term high over the next week. If that happens, this is most likely when the fractal similarity between the September and February rallies will part company. It will also provide a good excuse for SPX to re-test its high.
However, with the indicators still declining, more short-term weakness appears likely.
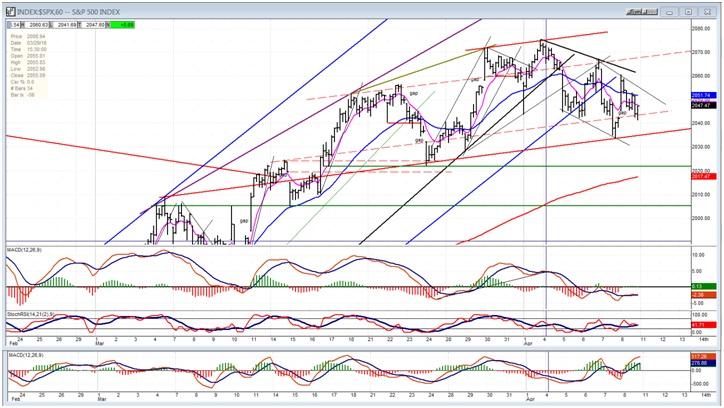
Hourly Chart
The high was preceded by negative divergence appearing in the hourly indicators, especially in the A/Ds. First, the trend line was broken, then the index came out of its channel. After making two lower lows, it rallied to back-test the channel line on Friday and was repulsed. Note, however, how strong the A/D oscillator was on that rally.
Overall, SPX still has the appearance of beingin a shallow uptrend (or a rounding top). This will change if it breaks below the red parallel line which has supported the last two short-term lows, and if it goes on to challenge the green horizontal line at 2020.It is imperative that this level be broken as an initial confirmation that a top is in place. Frankly, I have doubts that this can be accomplished before another test of the high.
The momentum indicators have already flattened out and could be ready to give a buy signal at any time. The A/Ds already have, but with the daily indicators still declining, it may be difficult for SPX to reverse its short-term downtrend this early.
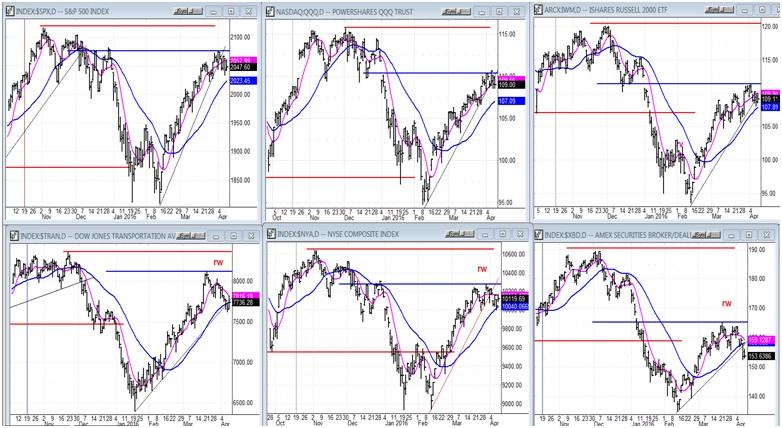
SPX et al…
The comparison of these key indexes to the SPX is a good way to gauge the internal condition of the overall market. Last week we noted some deterioration in two key indexes, relative to SPX: the TRAN and the XBD. Both of these continued to deteriorate last week, increasing their relative weakness to the SPX. The upper row did not show much change, but the NYA improved on Friday, as mentioned earlier. Needless to say, the performance of all these indexes next week relative to the main index will be extremely important.
While we are trying to assess the condition of the overall market and whether or not SPX has topped, early warnings have already been given by the indexes which appear below(especially by TRAN and XBD). That will remain in effect if these indexes retain their relative weakness during the next rally.
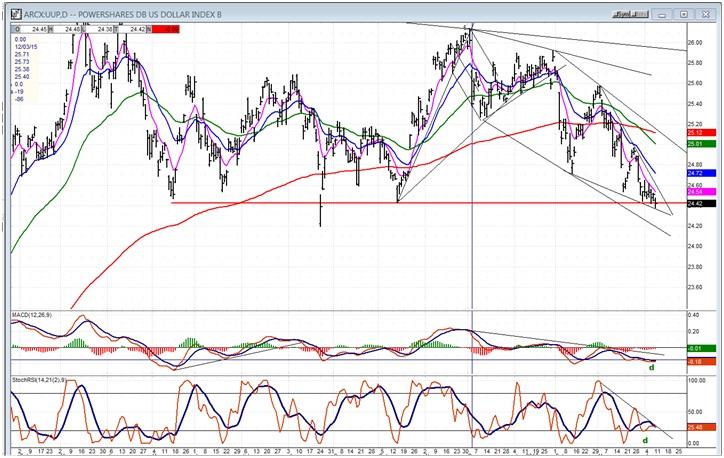
UUP (dollar ETF)
UUP has reached a critical level which it must hold if it has any chance of resuming its uptrend. There is some hope that it can since it has been holding above a strong support level for several days while attempts have been made to drive it below. If it can rise only 20 cents, it will be out of immediate trouble. The indicators which are showing some positive divergence are promising. The question is, even if it does this, can it sustain its move long enough to get out of the down channel and back above its 200-DMA.
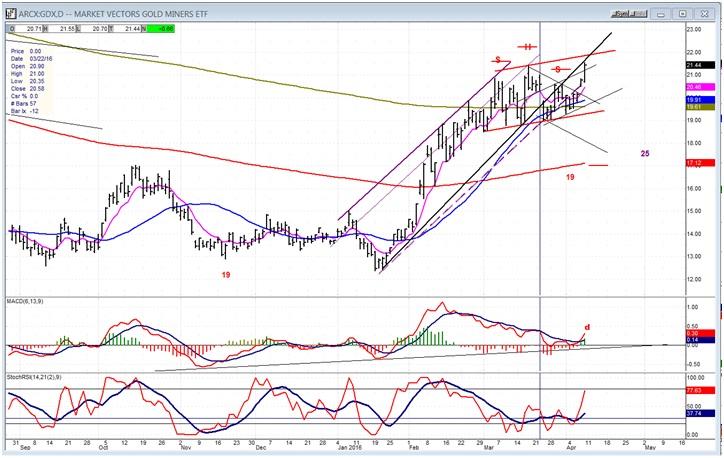
GDX (Gold Miners ETF)
GDX has disappointed the bears this past week, especially Thursday and Friday. Not only did it nullify a beautiful potential H&S pattern, but it made a new high and strongly suggests that the 19-week cycle bottomed surreptitiously, without fanfare. This is often the case when a pattern becomes obvious;it has a tendency to change. The strength in the index was caused by the recommendation of several gold mining stocks by analysts on Friday. On Thursday, it must have been known that this was coming and GDX started to move. Since bottoms of cycles are usually associated with some news item which acts as a catalyst, it is likely that the 19-wk cycle did make its low.
Although the response was not nearly as pronounced in GLD, it did decline to 115 on Thursday and rebounded to 118.85 by the end of the day, also suggesting a potential cycle low.
We’ll have to see how much of an uptrend is generated by this breakout. Before the 19-wk cycle became apparent, I was following the 25-wk cycle in gold which was then very regular. It appeared in the same exact time frame in GDX. That cycle had a couple of irregularities but, if I am correct, it is due to make its next low in the first week of May. It’s only a month away and that may curtail GDX’s upside potential, even if the 19-wk cycle did make its low.
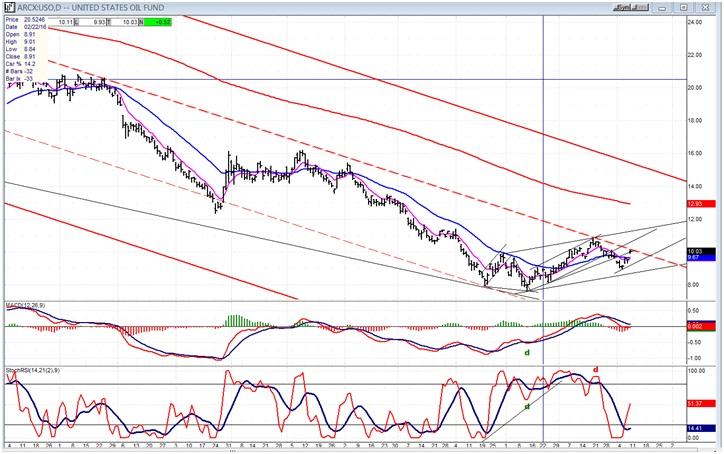
USO (US Oil Trust)
USO may have made a short-term low at 8.99 and be trying to extend its first move off the bottom. It this is genuine and if it isable to get past its recent high, it could make it to 11.50 before dropping back into its base.
Summary
SPX turned down at its stated projection target and started a minor correction but, unless it drops much lower over the short-term, it could soon re-test its recent high of 1975. It needs to be given more time so that the current action becomes clearer.
The comments made in the daily updates and the Market Summary about the financial markets are based purely on what I consider to be sound technical analysis principles. They represent my own opinion and are not meant to be construed as trading or investment advice, but are offered as an analytical point of view which might be of interest to those who follow stock market cycles and technical analysis.
Recommended Content
Editors’ Picks
AUD/USD favours extra retracements in the short term

AUD/USD kept the negative stance well in place and briefly broke below the key 0.6400 support to clinch a new low for the year on the back of the strong dollar and mixed results from the Chinese docket.
EUR/USD now shifts its attention to 1.0500

The ongoing upward momentum of the Greenback prompted EUR/USD to lose more ground, hitting new lows for 2024 around 1.0600, driven by the significant divergence in monetary policy between the Fed and the ECB.
Gold aiming to re-conquer the $2,400 level

Gold stages a correction on Tuesday and fluctuates in negative territory near $2,370 following Monday's upsurge. The benchmark 10-year US Treasury bond yield continues to push higher above 4.6% and makes it difficult for XAU/USD to gain traction.
Bitcoin price defends $60K as whales hold onto their BTC despite market dip

Bitcoin (BTC) price still has traders and investors at the edge of their seats as it slides further away from its all-time high (ATH) of $73,777. Some call it a shakeout meant to dispel the weak hands, while others see it as a buying opportunity.
Friday's Silver selloff may have actually been great news for silver bulls!

Silver endured a significant selloff last Friday. Was this another step forward in the bull market? This may seem counterintuitive, but GoldMoney founder James Turk thinks it was a positive sign for silver bulls.