Trading position (short-term; our opinion): In our opinion no positions are justified from the risk/reward perspective.
On Tuesday, crude oil lost 2.10% as worries over conflicts in Ukraine and Iraq waned. As a result, light crude dropped to its lowest level since Jan 21 and slipped below an important support area, hitting an intraday low of $94.26. Will the commodity correct to $93 per barrel in the near future?
Yesterday, the U.S. Commerce Department showed that the number of building permits issued in July jumped 8.1% to 1.052 million units (beating expectations for a 2.5% increase) and U.S. housing starts soared by 15.7% last month to hit 1.093 million units (well above expectations for an increase of 8.6%). Additionally, the U.S. CPI rose 0.1% in the previous month, while core consumer prices (without food and energy costs) increased by 0.1% last month, missing expectations for a 0.2% gain, but the year-on-year rate came in at 1.9%. Despite these bullish numbers, the price of light crude declined to almost eight month low as concerns over tensions in Ukraine and Iraq eased.
How much more room to decline does the commodity have? Let’s check the technical picture and find out (charts courtesy of http://stockcharts.com).
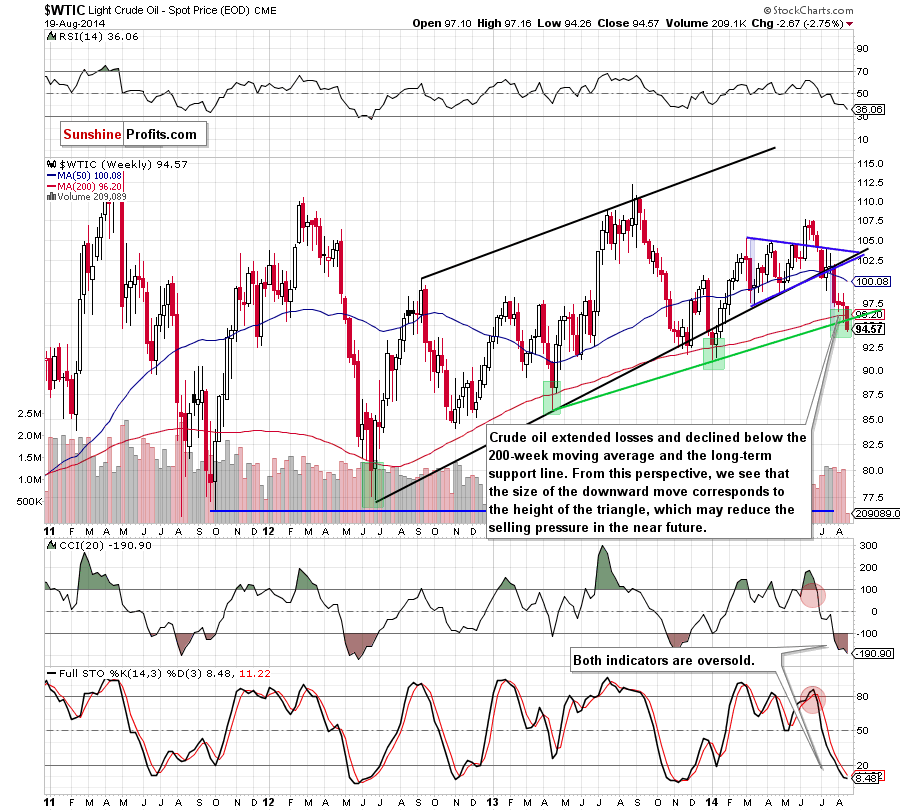
The situation in the medium term has deteriorated significantly as crude oil declined below its major support levels – the 200-week moving average and the rising, long-term support line. Although this is a strong bearish signal, the week is not over yet. This means that we may see a rebound and invalidation of the breakdown (similarly to what we saw in June 2012) – especially when we take into account the fact that the size of the current correction corresponds to the height of the blue triangle, which could reduce the selling pressure and trigger an upswing in the near future. Nevertheless, if the commodity closes this week under these two important support levels, we’ll see further deterioration and a drop to the next one – the January low of $91.24.
What can we infer from the daily chart? Let’s check.
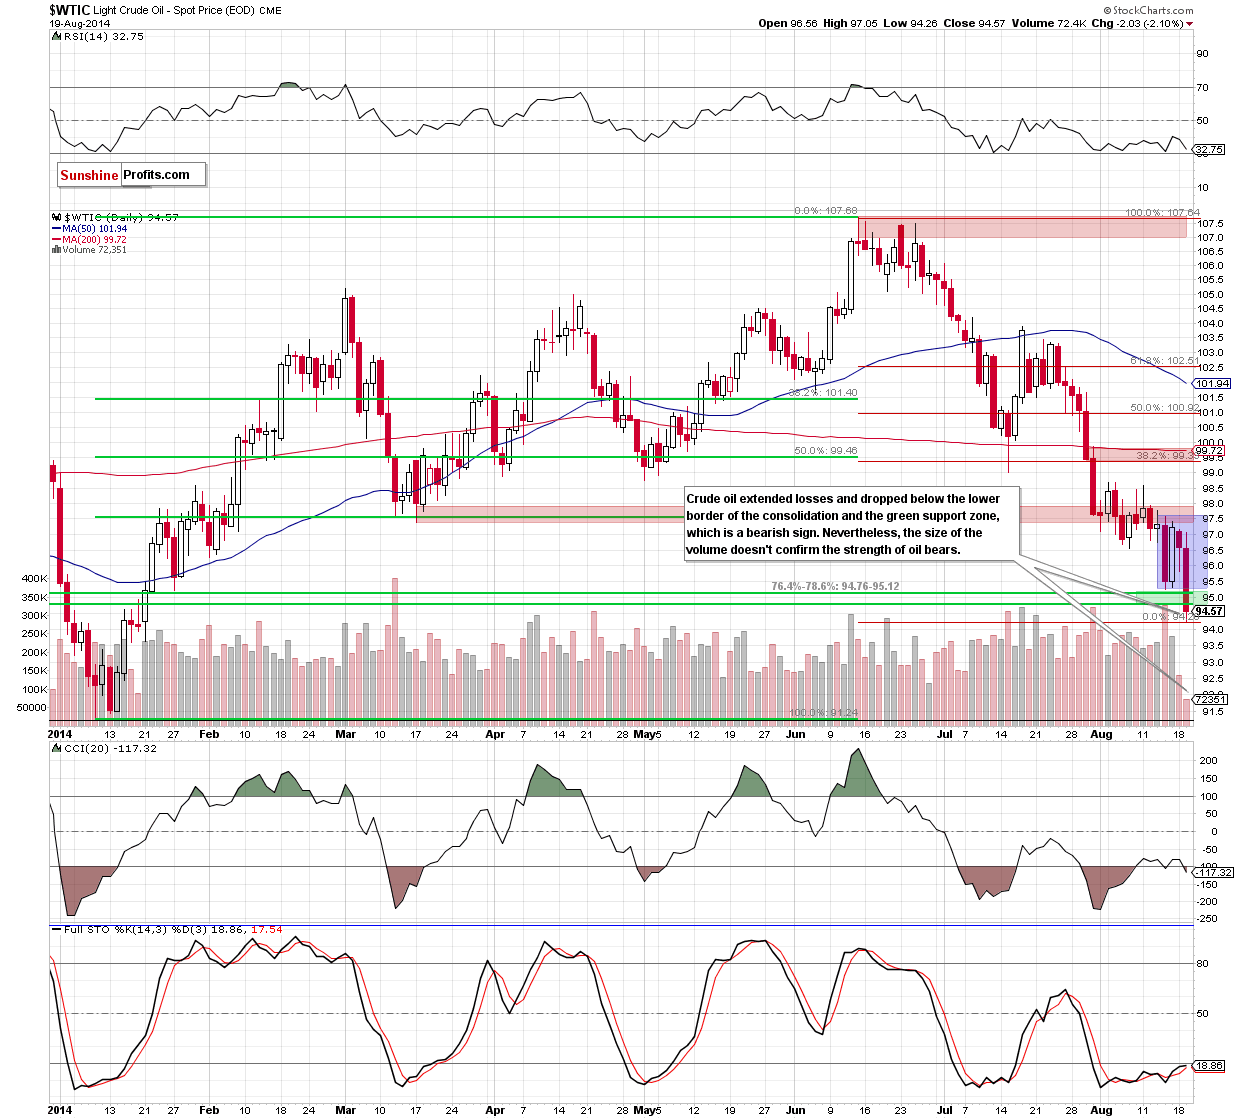
From this perspective we see that oil bears didn’t give up and broke not only below the lower border of the consolidation, but also under the green support zone. At the first glance this is a very strong negative signal, which suggests further deterioration and a drop to the next Fibonacci retracement level around $93.
Nevertheless, when we take a closer look at the above chart, we can see several positive factors, which make the situation less bearish. Firstly, there are clearly visible positive divergences between all three indicators and the price of light crude. Secondly, the size of the volume that accompanied the decline doesn’t confirm the strength of oil bears. As you can see on the above chart, the volume was tiny. This tells us that the selling pressure waned and suggests that we may see a reversal in the coming day (or days). Finally, with yesterday’s downswing crude oil approached the bottom of the correction that we saw in January, which serves as support and could encourage oil bulls to act.
Summing up, the most important event of yesterday’s session was a drop below the green support zone, created by two very important Fibonacci retracements. Although this is a bearish development, positive divergences (between all three indicators and the price of light crude) and the size of the volume suggest that we may see a reversal in the coming day (or days). Nevertheless, as long as there are no more valuable clues about the direction of future moves, staying on the sidelines waiting for another profitable opportunity is the best choice.
Very short-term outlook: mixed with bullish bias
Short-term outlook: mixed
MT outlook: mixed
LT outlook: bullish
Trading position (short-term; our opinion): No positions are justified from the risk/reward perspective at the moment, but we will keep you informed should anything change.
Recommended Content
Editors’ Picks
EUR/USD rises toward 1.0700 after Germany and EU PMI data

EUR/USD gains traction and rises toward 1.0700 in the European session on Monday. HCOB Composite PMI data from Germany and the Eurozone came in better than expected, providing a boost to the Euro. Focus shifts US PMI readings.
GBP/USD holds above 1.2350 after UK PMIs

GBP/USD clings to modest daily gains above 1.2350 in the European session on Tuesday. The data from the UK showed that the private sector continued to grow at an accelerating pace in April, helping Pound Sterling gather strength.
Gold price flirts with $2,300 amid receding safe-haven demand, reduced Fed rate cut bets

Gold price (XAU/USD) remains under heavy selling pressure for the second straight day on Tuesday and languishes near its lowest level in over two weeks, around the $2,300 mark heading into the European session.
Here’s why Ondo price hit new ATH amid bearish market outlook Premium

Ondo price shows no signs of slowing down after setting up an all-time high (ATH) at $1.05 on March 31. This development is likely to be followed by a correction and ATH but not necessarily in that order.
US S&P Global PMIs Preview: Economic expansion set to keep momentum in April

S&P Global Manufacturing PMI and Services PMI are both expected to come in at 52 in April’s flash estimate, highlighting an ongoing expansion in the private sector’s economic activity.

