Highlights
- Market movers: Weekly technical outlook
- The bulls are catching up to USDCNY
- Look ahead: Stocks
- Look ahead: Commodities
- Global data highlights
Market Movers: Weekly Technical Outlook
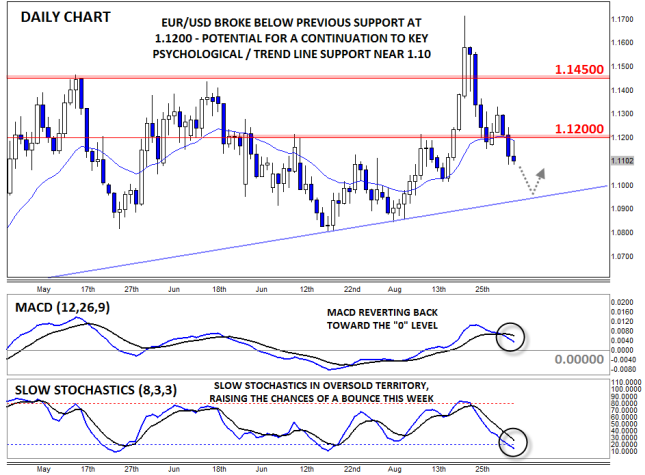
Technical Developments to Watch:- EUR/USD edging lower – potential for a move down to trend line support at 1.10
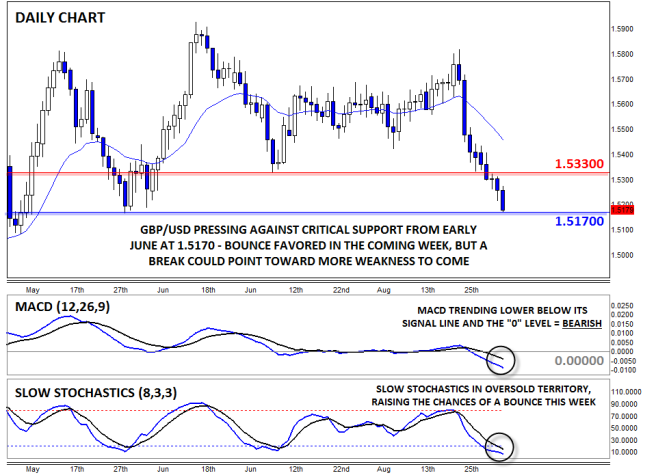
- GBP/USD testing key support from early June lows at 1.5170
- USD/JPY traders monitoring key support at 118.50
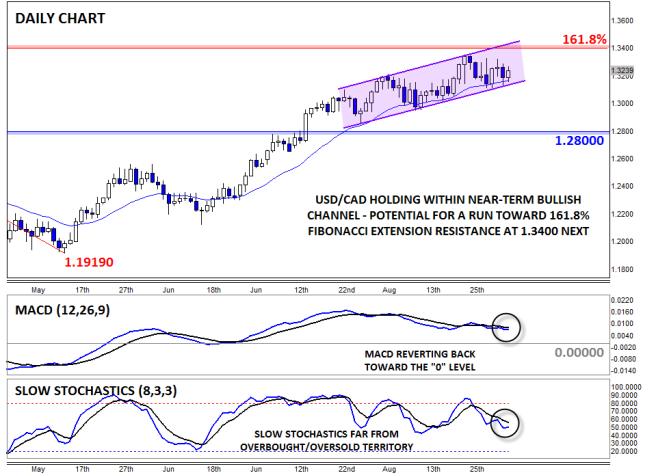
- USD/CAD in play, bullish channel could guide rates up toward 1.3400 resistance
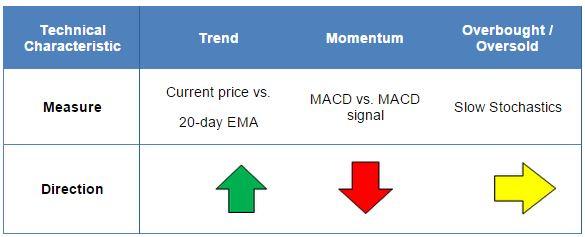
* Bias determined by the relationship between price and various EMAs. The following system determines bias (numbers represent how many EMAs the price closed the week above): 0 = Strongly Bearish, 1 = Slightly Bearish, 2 = Neutral, 3 = Slightly Bullish, 4 = Strongly Bullish.
** All data and comments in this report as of Friday afternoon **
EUR/USD
- EUR/USD edged higher early last week before rolling over on Draghi’s presser Thursday
- MACD is now signaling bearish momentum, though the Slow Stochastics are near oversold
- Potential for more downside toward 1.10 this week
Source: FOREX.com
GBP/USD
- GBP/USD continued to sell off, trading lower every day last week
- Slow Stochastics now deep in oversold territory
- Next major support level to watch will be the early June lows at 1.5170
Source: FOREX.com
USD/JPY
- USD/JPY traded consistently lower last week, reaching 118.50 support after NFP on Friday
- MACD still shows bearish momentum, Slow Stochastics neutral
- All eyes on the critical 118.50 level – if that floor gives way, the pair may target 116.00
Source: FOREX.com
USD/CAD
- USD/CAD held its ground last week, despite a rally in oil
- MACD and Slow Stochastics show essentially balanced, two-way trade
- Rally toward the 161.8% Fibonacci extension at 1.3400 still favored in the coming week
Source: FOREX.com
The bulls are catching up to USDCNY
USDCNY is the currency pairing that sparked a global flight from risky assets when the People’s Bank of China (PBoC) unexpectedly devalued the yuan against the US dollar by the largest amount in one day for over two decades. The PBoC widened USDCNY’s reference rate by 1.9% in mid-August in response to sustained upward pressure on the US dollar and threats to growth stemming from a weak exports sector in China. Since then USDCNY has retraced some of these gains after a brief stint above 6.4.USD is still king
Looking at the US dollar side of the equation, upward pressure on the world’s reserve currency has been easing lately as traders have discounted the possibility of tighter interest rates in the US this month. Turmoil in markets across the globe, fears of global deflation and a lack of inflation at home have cast doubt over the need for tighter monetary policy at this stage. It may be a mistake for the world’s first modern central bank to tighten the purse strings amidst such a toxic environment. This is making US dollar bulls nervous enough to even stem some safe haven flows into the US dollar that would normally occur in this kind of risk-adverse marketplace.
However, the US dollar is still king, as the Fed is still poised to be the first major central bank to raise interest rates in a long time (with the exception of a short hawkish run from the Reserve Bank of New Zealand). This means the US dollar is in the midst of a war between long-term bulls and short-term positioning. Overall, the medium/long-term implications for USDCNY should be positive, especially given China’s slowing economy and the accompanied monetary policy easing.
China needs a lower exchange rate
China’s economy needs support, at least according to a string of weak economic numbers. A strong exchange rate is a major hindrance for growth in China’s still important export sector, which is also struggling under the weight of soft global domestic demand and increased competition. A further depreciation of the renminbi could help ease some pressure and support overall economic activity that is also being weighed down by a lack of domestic demand.
So, why doesn’t the PBoC weaken CNY further?
The PBoC is reluctant to weaken the yuan further as it may increase capital outflows. Capital has been flowing out of China lately, partly due to the belief that the yuan has been overvalued, which is severely limiting the ability of the PBoC to spur economic activity through increased liquidity.
What does the market think?
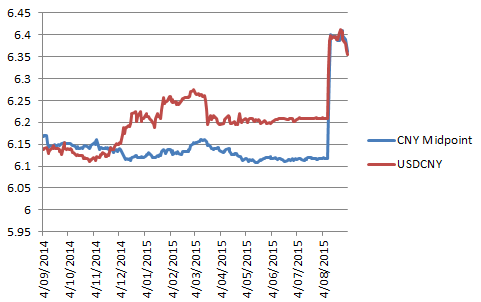
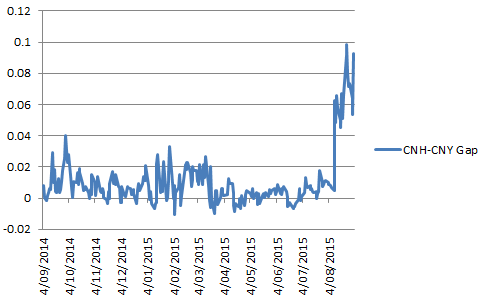
Downward pressure on CNY (onshore yuan) has greatly reduced since the PBoC’s decision to move USDCNY’s reference rate significantly higher, as evidenced by how close to its midpoint USDCNY is trading post-devaluation (see figure 1). However, there appears to be more downward pressure in offshore yuan (see figure 2) as the gap between offshore and onshore yuan widens. This could see upward pressure build in USDCNY in the medium term, especially if the market thinks the PBoC may weaken the yuan once more, which it may do given the futility of attempting to prevent capital outflows right now and the need to support its export sector.
Figure 1: USDCNY vs. its reference rate
Source: FOREX.com, Bloomberg
Figure 2: offshore/onshore gap
Source: FOREX.com, Bloomberg
Look ahead: Stocks
The stock market volatility remained elevated last week, in part because of the increased worries about the health of the global economy. Those concerns were momentarily put on the backburner after the European Central Bank President Mario Draghi struck a particularly dovish tone at the ECB press conference on Thursday as he signaled his willingness to take more action if needed. But the bounce failed to materialize into a sustainable rally and by Friday afternoon, European stock markets had fallen sharply once more. The much-anticipated US jobs report failed to inspire a rally either as the unexpectedly sharp drop in the unemployment rate and the stronger-than-expected increase in wage growth kept the prospects of a 2015 Federal Reserve rate rise alive. But the headline nonfarm payrolls figure disappointed expectations and this did little to alleviate investor concerns about the prospects of slower global economic growth and indeed the possibility of a Chinese hard landing. In Europe, the ECB published lower forecasts for both inflation and GDP in the Eurozone while in the UK all three key sectors – services, manufacturing and construction – saw their PMIs come in weaker than expected.These concerns are unlikely to be lifted next week because of the relatively lower number of major economic numbers from the US and Europe. But from China, we will have the latest trade figures on Tuesday and inflation numbers on Thursday. If the trend of weaker-than-forecasted data continues for China then equities could lose further ground.
The UK’s FTSE 100 could be one to watch among the major European stock indices next week. In the previous week, the index managed to bounce back sharply after a vicious sell-off as traders booked profit around key technical support levels. The bounce-back clearly offered fresh selling opportunities for some because, as can be seen from the updated weekly chart below, there was no-follow through in buying pressure this week. It is likely that a large number of market participants took advantage of the bounce to further reduce their long exposures, some probably even at a profit.
Indeed, when long-term trends change, it is very common for the markets to stage deep retracements. This is because most people will still be looking for trades that had worked well in the past: “buying the dips,” in the case of the FTSE and other major indices. These rebounds progressively get shallower and eventually the pressure gets too much and the long-term trend reverses. But the million-dollar question of course is: Are we there yet? Has the market already topped? While no one can answer this question with a high degree of confidence, the evidence in front of us certainly points to that direction.
If this view is correct, then we could see another sharp selloff if the bears win back control and take out the key long-term 6000 support level again. A decisive break below the 6000 level could see the FTSE at least revisit last week’s low around 5670. If it also breaks below this level then it could possibly drop to its long-term 38.2% Fibonacci retracement level at 5725, before deciding on its next move.
Meanwhile the bulls will want to see a decisive break above last week’s high of 6260 in order to confirm the potential reversal pattern that we saw on the weekly chart – a bullish hammer candle – last week. If it does break above 6260 then the next target for the bulls could be the previous support at 6410 or the back side of the broken trend line around 6500, levels that could potentially turn into resistance upon re-test.
Look ahead: Commodities
On Friday, the market had one of the most important indicators about the health of the world’s largest economy. The August US employment report was meant to give a clear indication about whether a 2015 rate hike was still on the cards, and if so, when: September or December? But it disappointed in that there was no huge surprises and it probably raised more questions than answers. As it turned out, the world’s largest economy created a still-healthy 173,000 jobs in August, which was admittedly notably lower than economists' forecasts of 215,000. But when you take into account the upward revisions to the prior two months’ reports, the average increase over the last three months was a good 221,000. On top of this, the rate of unemployment fell more sharply than expected to 5.1% from 5.3% in July as the labor participation rate remained at a 38-year low for the third straight month. Meanwhile the average hourly earnings – a key measure of inflation – increased slightly more than expected, up 0.3% on the month.Overall, it was a decent jobs report which keeps the 2015 rate hike prospects intact. As a result, the dollar rose across the board and gold, which is priced in the US currency, fell. In fact the precious metal has fallen quite sharply over the past couple of days and Friday’s selling has pushed the metal below the technically-important support area of around $1220/5. The metal’s failure to respond meaningfully to heightened stock market volatility suggests that further falls are likely next week, even if equities extend their declines. But the worst outcome for gold would be if stocks and dollar both rally. Conversely, if the dollar falls back next week then gold may find some much-needed support. Still, the likelihood of a sharp rally looks slim.
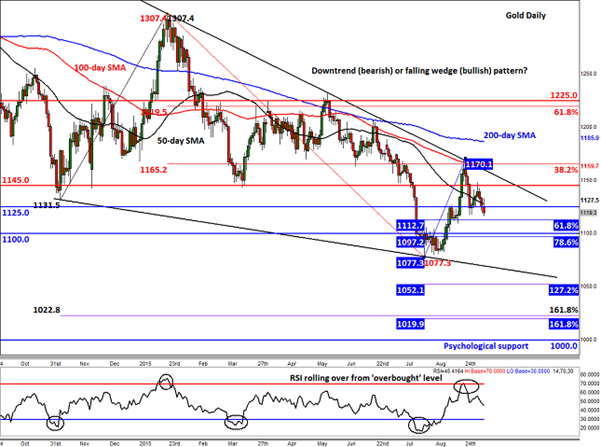
Gold’s most recent advance ended last week when price failed to break through the sturdy resistance level around $1170. As a reminder, $1170 is where several technical indicators converged, including a bearish trend line, the 100-day moving average and the 38.2% Fibonacci retracement level of this year’s range.
The fact that the rally has stalled at the relatively shallow 38.2% Fibonacci retracement level bodes ill for gold bugs as it suggests the bears are still clearly in the driving seat, which means that the path of least resistance is to the downside.
Thus, from here, it is more likely we will see lower rather higher price levels for gold, unless something changes dramatically about the metal’s still-weak fundamental outlook. If gold finishes Friday’s session below the $1120/5 resistance-turned-support range, then the next bearish targets could be the 61.8% Fibonacci retracement level of the most recent upswing at $1112/3 followed by $1100. Some of the longer-term technical levels to watch on the downside would be the July low at $1077, followed by the Fibonacci extension levels that are shown on the chart.
On the upside, there are at least three key short-term resistance levels that need to be watched closely. The first is around $1145, which roughly corresponds with this week’s earlier high. Then there is the bearish trend line, and depending on the speed of the potentially rally, this may come in somewhere below $1160, which incidentally also corresponds with the 100-day moving average. Finally, the August high of $1170 is the next key resistance. If this level breaks down then gold may stage a significant rally as some of the existing sellers will be forced to abandon their positions.
Source: FOREX.com
Global Data Highlights
Monday, September 71150GMT – Japan final GDP (Q2)
Japan’s economy is struggling from a lack of both domestic and international demand, and its economy has sunk back into recessionary territory as a result. Annualized GDP fell 1.6% in Q2 according to the to preliminary figures, but the final figures are expected to show an even deeper contraction of 1.8% q/q on soft exports and a lack of activity at the ground level in Japan. An even softer-than-expected number could magnify calls for further easing by the BoJ.
Tuesday, September 8
0130GMT – Australian Business Confidence Index (August)
Business confidence has been very volatile of late. In late Q1 and throughout Q2 business confidence seemed to be improving after a very dismal 2014, but this all changed at the beginning of this quarter and may deteriorate further alongside global sentiment. NAB’s Business Confidence Index fell to 3.5 in July, after peaking at 8.2 at the end of Q2, and another drop in the index may push it into contraction territory.
Tentative – China trade numbers (August)
China has been at the forefront of investor attention after the PBoC’s surprise decision to devalue the yuan mid-way through last month. One reason why the central bank may have done this is to ease pressure on exporters that are struggling from a lack of global demand and a relatively strong exchange rate. In August, the market is expecting exports and imports to fall 6.1% and 7.7% respectively, which is slightly better than the prior month’s figures.
Wednesday, September 9
0830GMT – UK manufacturing and industrial production (July)
Manufacturing and industrial production may have both increased at 0.2% m/m in July, after the latter dropped 0.4% in the prior month. Weakness in the export sector from a strong pound is hurting manufacturing, as evidence by a recent decline in manufacturing sentiment.
1400GMT – Bank of Canada
The Bank of Canada (BoC) has cut interest rates twice this year by 25 basis points each time in response to an economic slowdown brought about by a collapse in oil prices. This is likely the most easing we’ll see from the BoC in the near-term, with rates already at an accommodative 0.5%. In fact, the market is split on whether the next move will be a hike or another cut, although no one is expecting the bank to hike for a long time.
2100GMT – Reserve Bank of New Zealand
The Reserve Bank of New Zealand has been on hiatus since late July; thus, kiwi traders are eagerly awaiting this meeting for further policy guidance. At its last meeting, Governor Stevens noted that while further policy loosening was likely, serve policy easing wasn’t necessary. This time around the bank is widely expected to lob another 25 basis points off the official cash rate, bringing it to 2.75%. All 17 economists surveyed by Bloomberg and around 90 of the market expect the bank to loosen monetary policy this time around, thus investors will be focused on the bank’s tone and what its views on the kiwi are.
Thursday, September 10
0130GMT – Australian labor market report (August)
July’s mixed labor market report out of Australia was taken with a grain of salt, largely because the ABS has reviewed the way it calculates the data and there are questions about the accuracy of the new figures. Overall, the report was encouraging due an increase in employment and a jump in the participation rate, but a strong uptick in the unemployment rate to 6.3% rattled the market. This time around the market is expecting a slight drop in the unemployment rate to 6.2% and, unfortunately, the participation rate to 65.0% (prior 65.1%), while total employment may increase by a more reasonable 5K.
0130GMT – China’s inflation data
The health of domestic demand in China has been questioned lately, with imports plummeting and other indicators of domestic economic activity slowing. However, inflation is expected to rebound in August with the CPI anticipated to rise 1.9% y/y, after steadily increasing for most of this year on widespread monetary policy easing from China’s central bank.
1100GMT – Bank of England
The Bank of England (BoE) has stated that a slowdown in China’s economy could further weigh on inflation, but it hasn’t changed its current outlook for interest rates: at least not yet. Governor Mark Carney noted last week that a gradual recovery in Britain’s economy will likely put the decision as to when to start the process of gradual monetary policy normalization into sharper focus around the turn of this year. At this meeting, there is virtually zero chance that the MPC will move interest rates from 0.5%; general consensus that the first move may be around Q1 next year.
Friday, September 11
1400GMT – Preliminary UoM Consumer Sentiment Index (September)
With all eyes on the Fed ahead of a very important monetary policy meeting next week, every bit of economic data is going to take on extra significance. Consumer sentiment has recovered well in the last few years and remains well above post-GFC lows, and it should add weight to the case for tighter monetary this year. This time around the University of Michigan Sentiment Index may fall to 91.5.
Information on these pages contains forward-looking statements that involve risks and uncertainties. Markets and instruments profiled on this page are for informational purposes only and should not in any way come across as a recommendation to buy or sell in these assets. You should do your own thorough research before making any investment decisions. FXStreet does not in any way guarantee that this information is free from mistakes, errors, or material misstatements. It also does not guarantee that this information is of a timely nature. Investing in Open Markets involves a great deal of risk, including the loss of all or a portion of your investment, as well as emotional distress. All risks, losses and costs associated with investing, including total loss of principal, are your responsibility. The views and opinions expressed in this article are those of the authors and do not necessarily reflect the official policy or position of FXStreet nor its advertisers. The author will not be held responsible for information that is found at the end of links posted on this page.
If not otherwise explicitly mentioned in the body of the article, at the time of writing, the author has no position in any stock mentioned in this article and no business relationship with any company mentioned. The author has not received compensation for writing this article, other than from FXStreet.
FXStreet and the author do not provide personalized recommendations. The author makes no representations as to the accuracy, completeness, or suitability of this information. FXStreet and the author will not be liable for any errors, omissions or any losses, injuries or damages arising from this information and its display or use. Errors and omissions excepted.
The author and FXStreet are not registered investment advisors and nothing in this article is intended to be investment advice.
Recommended Content
Editors’ Picks
EUR/USD climbs to 10-day highs above 1.0700

EUR/USD gained traction and rose to its highest level in over a week above 1.0700 in the American session on Tuesday. The renewed US Dollar weakness following the disappointing PMI data helps the pair stretch higher.
GBP/USD extends recovery beyond 1.2400 on broad USD weakness

GBP/USD gathered bullish momentum and extended its daily rebound toward 1.2450 in the second half of the day. The US Dollar came under heavy selling pressure after weaker-than-forecast PMI data and fueled the pair's rally.
Gold rebounds to $2,320 as US yields turn south

Gold reversed its direction and rose to the $2,320 area, erasing a large portion of its daily losses in the process. The benchmark 10-year US Treasury bond yield stays in the red below 4.6% following the weak US PMI data and supports XAU/USD.
Here’s why Ondo price hit new ATH amid bearish market outlook Premium

Ondo price shows no signs of slowing down after setting up an all-time high (ATH) at $1.05 on March 31. This development is likely to be followed by a correction and ATH but not necessarily in that order.
Germany’s economic come back

Germany is the sick man of Europe no more. Thanks to its service sector, it now appears that it will exit recession, and the economic future could be bright. The PMI data for April surprised on the upside for Germany, led by the service sector.