- Market movers: Weekly technical outlook
- Signs of life for Aussie, Kiwi ahead of key Chinese data
- Look ahead: Stocks
- Look ahead: Commodities
- Global data highlights
Market movers: Weekly technical outlook
Technical Developments to Watch:
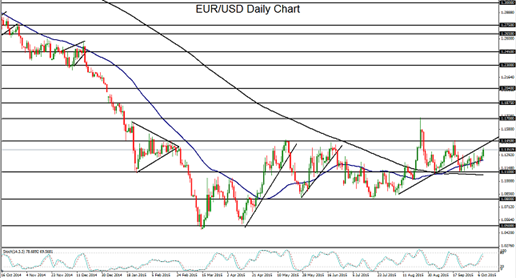
- EUR/USD bulls may look to target further upside at or above 1.1450 resistance after rally on weakened dollar
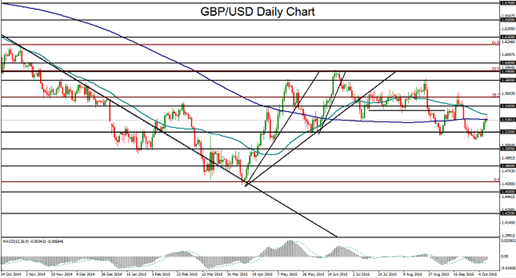
- GBP/USD facing resistance and could turn lower back towards 1.5000
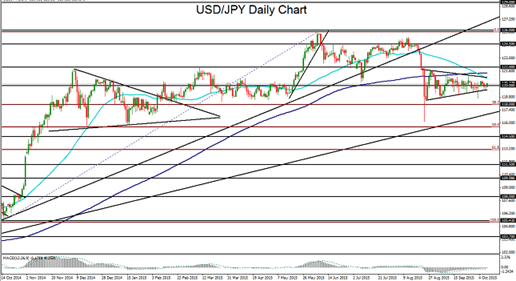
- USD/JPY moving average “death cross” and tight triangle consolidation still in play
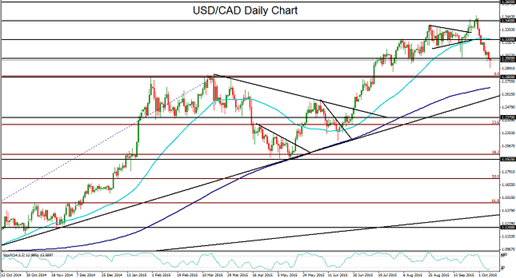
- USD/CAD bounce possible around or above 1.2800 support
EUR/USD
The past week saw EUR/USD continue its steady climb on a weakened US dollar. The upper border resistance of the current consolidation is around the 1.1450 level. Bulls may look to further target that level and above on a continued dollar pullback. Any sustained rise above 1.1450 could switch momentum back to the bulls as EUR/USD looks to recover possibly towards the 1.1700 highs. Major support remains at the 1.1100 level and 200-day moving average.
GBP/USD
GBP/USD climbed in the past week from below 1.5200 up to approach the 1.5400 level. In the process, the currency pair has reached back up to its relatively flat and closely-situated 200-day and 50-day moving averages. With any further rebound momentum, major resistance lies at the 1.5500 level. But at or below that level, a turn back down to 1.5200 should once again begin targeting the 1.5000 psychological support objective.
USD/JPY
USD/JPY has continued to range-trade in a converging consolidation, otherwise known as a triangle pattern. This pattern has been in place since late August. Of particular note from a technical perspective, the 50-day moving average has recently crossed below the 200-day moving average, creating a potential “death cross” technical scenario that could presage further downside for USD/JPY in the event of a return to global market volatility and a potential flight to the yen. On any breakdown below the triangle pattern, the currency pair could then target the next major objectives at the 118.00 and then 116.00 support levels. Upside resistance on any sustained trading above 120.00 continues to reside around the upper border of the noted triangle pattern.
USD/CAD
USD/CAD has spent the past couple of weeks plunging from late September’s 11-year high of 1.3456. This sustained drop has been the result of rebounding crude oil prices combined with a pullback in the US dollar. Having broken down below the 1.3000 psychological support level, USD/CAD could be poised for further downside as perceptions of a more dovish Fed weigh on the US dollar and help give a further boost to crude oil. At the same time, however, major support continues to loom directly below, around the 1.2800 level, which represents the previous long-term highs before the upside breakout in mid-July. On any continued move down to approach 1.2800, USD/CAD should find support and a possible rebound and recovery after its recent sharp slide.
Signs of life in the Aussie and Kiwi ahead of key Chinese data
There are signs of life in AUDUSD and NZDUSD, albeit tentative ones. Asia’s major commodity currencies have risen off multi-year lows against numerous currencies and are now rallying hard against the US dollar. Since bottoming out at the end of September, NZDUSD and AUDNZD have risen around 6.3% and 4.1% respectively, with the former being the best performing currency against the US dollar over that period.
What’s behind the rally?
An improvement in global risk appetite is supporting the risky Aussie and kiwi and the US dollar is suffering as investors push out expectations for tighter monetary policy in the world’s largest economy. A lack of inflation in the US is casting doubt over the need for rate hikes from the Fed which is, in turn, weakening the US dollar and even causing investors to question the recent rally. Meanwhile, the deluge of negative data from China has seemed to have stopped, at least for the moment, and the kiwi and Aussie have seen increased domestic support.
A rebound in dairy prices is supporting the kiwi
Dairy prices are rebounding – prices have increased by around 10% or more at the last four GDT auctions – and the domestic economy is showing signs of life, with manufacturing sentiment picking up in August alongside a still-strong housing market. This may be enough to push the RBNZ into neutral as soon as this month. The market isn’t expecting the RBNZ to cut the official cash rate in October any more, with swap markets pricing in around a 26% chance of a cut at the end of this month, down from almost 50% at the end of last month.
The Aussie is also be supported by an improving rates outlook
At its policy meeting last week the Reserve Bank of Australia (RBA) didn’t succumb to pressure to introduce a more dovish tone in light of softer-than-expected economic data. The bank remains firmly in wait-and-see mode, which has helped AUDUSD re-establish its position above 0.7000 and then 0.7200.
China’s all-important economic numbers
However, both commodities currency are very vulnerable to overall investor sentiment, especially when it’s being dictated by events in China. The health of world’s second largest economy has been under the microscope lately due to questionable economic data and extreme volatility in its stock markets. The crux of the issue is a lack of domestic economy activity and soft global demand, which is limiting economic growth. Trade figures will provide the market with a glimpse into the performance of trade exposed sectors, with export numbers providing a gauge of global demand for Chinese goods and the import numbers looking at the health of the domestic economy (exports are expected to fall 6% and imports 16%, with an overall trade balance of $48.22bn). Inflation numbers late in the week will then provide a more detailed look at the domestic economy. The market is fairly downbeat in the lead up to this report which is expected to show that the year-on-year pace of inflation in China slowed to 1.8% in September, from 2.0% in the prior month. Meanwhile, factory gate prices are expected to remain in deflationary at -5.9% y/y.
Look ahead: Stocks
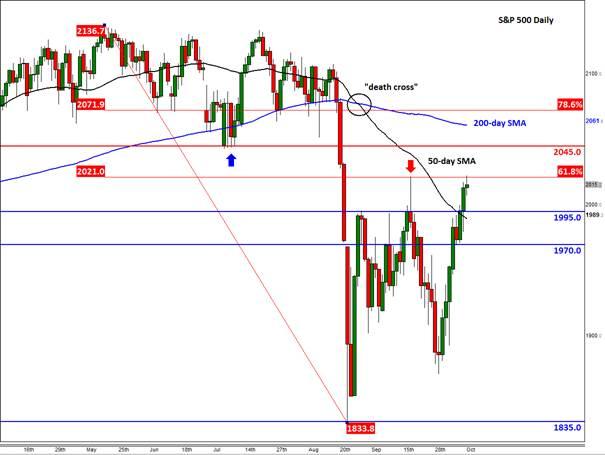
US stock markets have sharply extended their gains and are set to close higher for the second straight week, though at the time of this writing on Friday the indices were struggling a little bit after Alcoa kicked off the earnings season on a downbeat note. Sentiment has improved in part because of expectations that US interest rates will remain low for longer than previously thought due to a dovish Federal Reserve and amid weaker-than-expected US data. The rallying prices of oil and gold have also boosted commodity stocks. In addition, Chinese concerns have been pushed to the backburner for the time being, though these worries may resurface if next week’s data from China disappoint expectations. In fact, next week could be a big one for the markets due to the sheer number of high-impact global data and US earnings that will be coming in thick and fast. So expect the volatility to remain high, particularly as the major US indices approach major technical levels.
Some of the key earnings for the S&P 500 companies next week are as follows:
- Tuesday: Johnson & Johnson, Procter & Gamble and Intel
- Wednesday: Delta Air Lines, BlackRock, Bank of America, Wells Fargo & Co, News Corp, Netflix
- Thursday: Citigroup, Charles Schwab, Goldman Sachs Group, U.S. Bancorp
- Friday: Honeywell International and General Electric
Look ahead: Commodities
WTI crude oil prices surged higher at the start of the week before falling slightly on Wednesday on the back the latest weekly EIA crude oil stocks data which showed a surprise build of 3.1 million barrels for the week ending October 2. But speculators have been quick to dismiss that small but noticeable rise on seasonal factors as, after all, the end of the summer driving season means there will usually be less demand for gasoline at this time of the year anyway. Indeed, gasoline stocks did in fact increase by 1.9 million barrels that week, pointing to reduced demand. Oil refineries also carry out their usual maintenance works at this time of the year and ahead of the winter months – hence the notable fall in the refinery utilization rate.
Many investors are starting to believe that US shale oil output is going to be reduced noticeably and are thus betting that prices will recover from these levels as the global glut is slowly reduced. The CFTC’s positioning data should confirm this when the markets close for trading on Friday. Inventors’ growing confidence on the oil market has been given an additional lift by comments from the OPEC’s Secretary-General Al-Badri who said that oil demand will climb more this year than previously projected (by 1.5 million barrels a day), and as the EIA predicted that global oil companies will cut investments in crude exploration and production by 20% this year. Russia’s controversial and apparently imprecise bombardment of IS targets in Syria is further heightening the geopolitical risks in the Middle East region and this is also helping to push oil prices higher.
In addition, the dollar weakness has persisted after the FOMC’s September meeting minutes did not provide any major surprises. This is providing a boost to the buck-denominated commodities across the board with gold also climbing above a major resistance area as we end a very good week for commodities. Equities are also pushing higher as the third-quarter earnings season gets underway and on growing expectations that the Fed will hold off raising rates until next year, giving the “risk-on” trade a further boost.
The sentiment on the oil market is therefore improving and WTI is set to have its best week in 6 years, as things stood at the time of this writing. So, we could see further gains early next week, provided of course we don’t have any nasty surprises – for example, from Baker Hughes’ rig count data on Friday evening or China’s macroeconomic numbers next week.
From a slightly longer-term view point, however, it is questionable how far this rally will go because the excessive supply of crude is unlikely to be removed meaningfully any time soon. Increased production from the likes of Iran, Libya and Russia to name but a few will probably offset the expected production cuts in the US. Indeed, if oil prices rise significantly then it is easy for US shale companies to ramp up production once more.
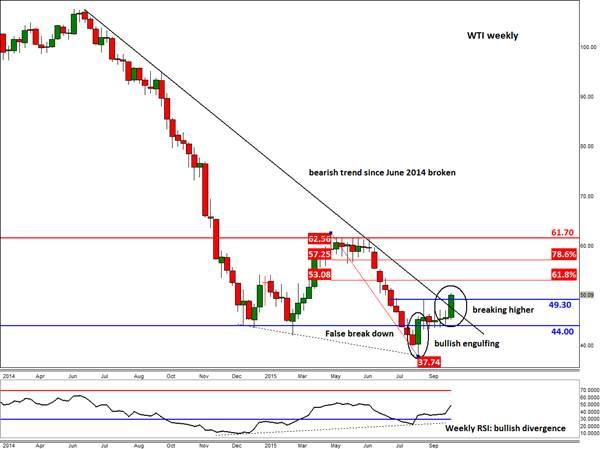
Nevertheless, the short-term positivity in the oil market has been accompanied by a major technical breakthrough this week as WTI has finally broken down its bearish trend line that has been established since prices peaked in the summer of last year. WTI has also broken above the August high of $49.30, thereby confirming the trend breakout and the false breakdown reversal pattern that had occurred earlier that month. As things stand therefore, WTI could easily reach its 200-day SMA at just below $51 (not shown on the chart) before climbing towards the Fibonacci levels of the downswing from the summer of this year around $53.05 (61.8%) and $57.25 (78.6%). The major resistance and this year’s high reside around $61.70/$62.55.
The short-term bullish outlook will become questionable if WTI oil prices fall back and hold below the old resistance level at $49.30 and completely invalid on a potential break below $44.00.
Global Data Highlights
Tuesday, October 13
Tentative - China’s trade data (September)
The health of the world’s second largest economy has been under the microscope lately due to questionable economic data and extreme volatility in its stock markets. The crux of the issue is a lack of domestic economy activity and soft global demand, which is limiting economic growth. Trade figures will provide the market with a glimpse into the performance of trade exposed sectors, with export numbers providing a gauge of global demand for Chinese goods and the import numbers looking at the health of the domestic economy. Exports are expected to fall 6% and imports 16%, with an overall balance $48.22bn.
0830GMT – UK CPI (September)
Inflation is the key economic ingredient missing in the UK, and globally for that matter. In the UK, the year-on-year pace of inflation dropped to 0% in August, further deteriorating the notion of tighter monetary policy in the UK. In September, CPI is expected to expand by a measly 0.2% m/m and y/y.
0900GMT – German ZEW Economic Sentiment (October)
The health of the economic heart of the Eurozone is very important to the market, with the market expecting a slight deterioration in the much-watched ZEW Economic Sentiment Index to 65.8, from 67.5.
Wednesday, October 14
0130GMT – China CPI (September)
This may be the most important piece of economic data this week, at least from a market perspective. The market is fairly downbeat in the lead up to this report which is expected to show that the year-on-year pace of inflation in China slowed to 1.8% in September, from 2.0% in the prior month. Meanwhile, factory gate prices are expected to remain in deflationary at -5.9% y/y.
1230GMT – US retail sales (September)
In July, US retail sales rebounded as households boosted purchases of automobiles and other goods, but then retreated once more in August. This raised some concerns about the health of the US economy at the ground level and is likely at the back of the Fed’s mind. This time around we are expecting advance retail sales to increase 0.2% m/m in September.
Thursday, October 15
0030GMT – Australia employment report (September)
July’s mixed labor market report out of Australia was taken with a grain of salt, largely because the ABS has reviewed the way it calculates the data and there are questions about the accuracy of the new figures, but it was supported by an encouraging report for August. The main concern was a strong uptick in the unemployment rate to 6.2% in July, but it hasn’t moved since and isn’t expected to move soon. This time around the market is expecting the economy to have added around 7.1K jobs in September, backed up by a stable participation rate.
1230GMT – US CPI (September)
While it’s hard to argue that the US economy isn’t gathering steam, consumer price growth remains stagnant, which could be the deciding factor if the FOMC elects not to raise interest rates in the near-term. Consumer prices are expected to have fallen 0.2% m/m and core-CPI is expected to rise only 0.1% m/m in August, dragging the year-on-year pace of growth down to -0.2%.
2145GMT – NZ CPI (Q3)
This is a very important release for the Kiwi, as it may determine whether the RBNZ cuts interest rates later in the month. While the market is expecting the pace of inflation to soften last quarter to 0.2% q/q from 0.4%, these can be blamed on temporary factors and CPI is being supported by already accommodative monetary policy. However, a softer-than-expected print could be enough to send the Kiwi tumbling.
Friday, October 16
1400GMT – US consumer sentiment (October)
Consumer sentiment has recovered well in the last few years and remains well above post-GFC lows, and it should add weight to the case for tighter monetary this year. This time around the University of Michigan Sentiment Index may recover to 88.5.
Trading leveraged products such as FX, CFDs and Spread Bets carry a high level of risk which means you could lose your capital and is therefore not suitable for all investors. All of this website’s contents and information provided by Fawad Razaqzada elsewhere, such as on telegram and other social channels, including news, opinions, market analyses, trade ideas, trade signals or other information are solely provided as general market commentary and do not constitute a recommendation or investment advice. Please ensure you fully understand the risks involved by reading our disclaimer, terms and policies.
Recommended Content
Editors’ Picks
EUR/USD clings to daily gains above 1.0650

EUR/USD gained traction and turned positive on the day above 1.0650. The improvement seen in risk mood following the earlier flight to safety weighs on the US Dollar ahead of the weekend and helps the pair push higher.
GBP/USD recovers toward 1.2450 after UK Retail Sales data

GBP/USD reversed its direction and advanced to the 1.2450 area after touching a fresh multi-month low below 1.2400 in the Asian session. The positive shift seen in risk mood on easing fears over a deepening Iran-Israel conflict supports the pair.
Gold holds steady at around $2,380 following earlier spike

Gold stabilized near $2,380 after spiking above $2,400 with the immediate reaction to reports of Israel striking Iran. Meanwhile, the pullback seen in the US Treasury bond yields helps XAU/USD hold its ground.
Bitcoin Weekly Forecast: BTC post-halving rally could be partially priced in Premium

Bitcoin price shows no signs of directional bias while it holds above $60,000. The fourth BTC halving is partially priced in, according to Deutsche Bank’s research.
Week ahead – US GDP and BoJ decision on top of next week’s agenda

US GDP, core PCE and PMIs the next tests for the Dollar. Investors await BoJ for guidance about next rate hike. EU and UK PMIs, as well as Australian CPIs also on tap.