Highlights
- Market movers: Weekly technical outlook
- AUDUSD gears up for a big week
- Look ahead: Stocks
- Look ahead: Commodities
- Global data highlights
Market Movers: Weekly Technical Outlook
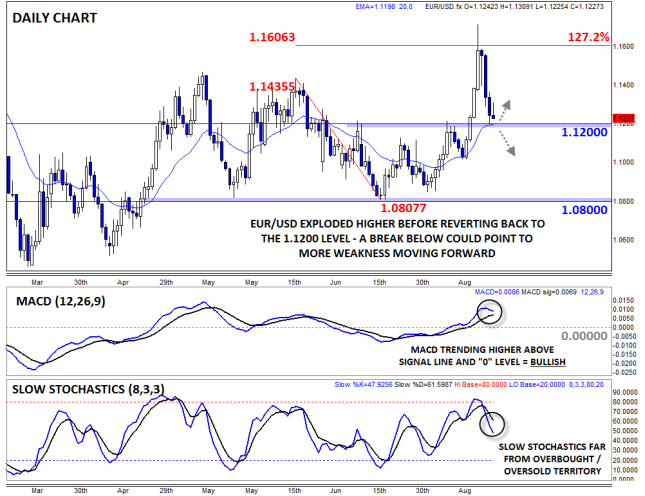
Technical Developments to Watch:- EUR/USD testing support at 1.1200 after a big rally and reversal
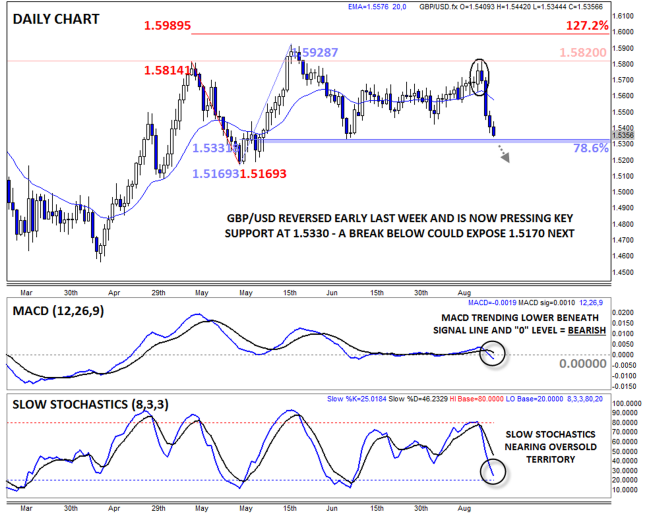
- GBP/USD also near a key level (1.5360) following last week’s collapse
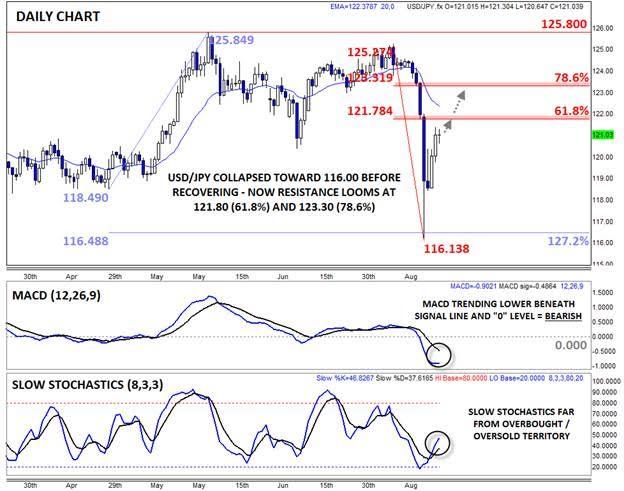
- USD/JPY could recover slightly, but the longer-term uptrend has been damaged
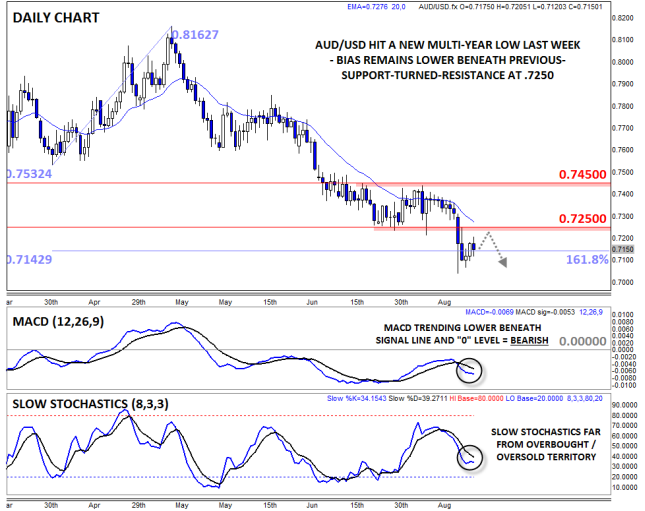
- AUD/USD in play, bias remains lower beneath the .7250 level
* Bias determined by the relationship between price and various EMAs. The following system determines bias (numbers represent how many EMAs the price closed the week above): 0 = Strongly Bearish, 1 = Slightly Bearish, 2 = Neutral, 3 = Slightly Bullish, 4 = Strongly Bullish.
** All data and comments in this report as of Friday afternoon **
EUR/USD
- EUR/USD spiked, then reversed in volatile trade last week
- MACD still (barely) shows bullish momentum
- The critical level to watch will be previous-resistance-turned-support at 1.1200/20
Source: FOREX.com
GBP/USD
- GBP/USD collapsed last week, falling over 400 pips from the weekly peak to trough
- MACD now shows bearish momentum, though Slow Stochastics are nearly oversold
- Bears will try to break support at 1.5330 this week
 Source: FOREX.com
USD/JPY
- USD/JPY collapsed Monday before regaining most of the losses over the rest of the week
- MACD still shows bearish momentum, Slow Stochastics neutral
- Near-term resistance looms at 121.80 (61.8% Fibo) and 123.30 (78.6%)
USD/JPY collapsed on Monday, tanking an incredible 450 pips in a matter of hours to hit a new 7-month low near 1.1600, but the pair has clawed its way all the way back toward 121.00 as of writing. After Monday’s staggering move, bulls have had their faith in the long-term trend shaken, so it seems unlikely that we’ll immediately resume the previous uptrend, though a snap back to either 121.80, the 61.8% Fibonacci retracement, or 123.30, the 78.6% Fibo, could be seen near-term.
Source: FOREX.com
AUD/USD
- AUD/USD broke down to a new multi-year low last week
- MACD still shows bearish momentum, Slow Stochastics neutral
- Previous support-turned-resistance at .7250 may cap any near-term rallies this week
AUD/USD is our currency pair in play this week due to a number of high-impact economic reports out of Australia, the US and China this week (see the “Global Data Highlights” section below for more). The pair dropped to a new multi-year low amidst Monday’s turmoil before stabilizing in the .7100s for the rest of the week. As it stands, the MACD still shows bearish momentum, so traders may look to fade any near-term rallies toward .7250 resistance.
Source: FOREX.com
AUD/USD gears up for a big week
It’s going to be another massive week for AUDUSD, with a monetary policy meeting in Australia and important economic data out of China, the US and Australia, all while the market keeps one eye on conditions in China. At the beginning of last week AUDUSD was mauled by bears as investors fled the risky aussie for the safe haven status of the US dollar, sparked by extremely volatile conditions in China’s stock markets. The Shanghai Composite dropped 8.5% on Monday and then 7.6% on Tuesday, adding to earlier losses for a total fall of around 22% in a four-day period, pushing the index into negative territory for the year.The People’s Bank of China (PBoC) was finally able to calm the market by cutting interest rates for the fifth time since November and signalling a reduction in the amount that banks are required to hold in reserve. The PBoC cut one-year lending and borrowing rates by 25bps each and will reduce the reserve requirement ratio (RRR) by 50bps on September 6, which was somewhat successful in restoring investor confidence and appetite for risk.
China’s manufacturing sector is under a microscope
China releases two sets of manufacturing numbers on Tuesday. The official Manufacturing PMI is expected to drop into contraction territory for the first time since February (exp. 49.7). The private sector figures are expected to show a slight improvement after the flash figures came as a huge disappointment (expected 47.3). China’s all-important manufacturing sector is struggling from a lack of demand and economic activity; thus, sentiment is deteriorating across the board, and further weakness could spell disaster for the commodity backed Australian dollar. Yet, a strong print would go a long way to restoring investor confidence.
The RBA is expected to hold fire as GDP sinks
Also on Tuesday, the Reserve Bank of Australia is widely expected to leave the official cash rate at 2.00%. In fact, all 25 economists surveyed by Bloomberg expected no change this time around, but the doves are getting louder. The recent volatility in the market, coupled with some slightly disappointing economic data, has increased the chance for further policy loosening from the RBA over the coming months. The market will be closely watching Governor Stevens’ accompanying statement for any indications that the bank has reengaged its easing bias, and if it has the Aussie may be mauled by bears once more, but if it hasn’t it may be the green light that AUD bulls have been waiting for.
On Wednesday, Aussie traders, and the RBA for that matter, will be watching Australia’s Q2 GDP numbers to help determine the overall performance of the economy. This time around the market is expecting the economy to have expanded 0.4% q/q and 2.1% y/y in Q2, down from 0.9% q/q and 2.3% y/y in the prior quarter. This level of growth is well below Australia’s long-run average and the economy may require further support, especially given last week’s lackluster Q2 capital expenditure numbers which showed only mild signs of life outside of the deteriorating mining sector.
The almighty NFP
Perhaps the biggest data release for AUDUSD next week is the all-important US employment report for August. This report, which includes NFP figures, the unemployment rate and wage data, is a major factor in the setting of monetary policy in the US; hence why it can be the most-watched economic release in the world. The market is getting used to expecting a lot from these reports lately, with no one really questing that the US labor market is heading in the right direction. However, further wage growth is key to the overall health of the economy and the outlook for interest rates. This time around the market is expecting a headline NFP figure of 218K, and unemployment rate of 5.3% and average hourly earnings to jump 0.2% m/m.
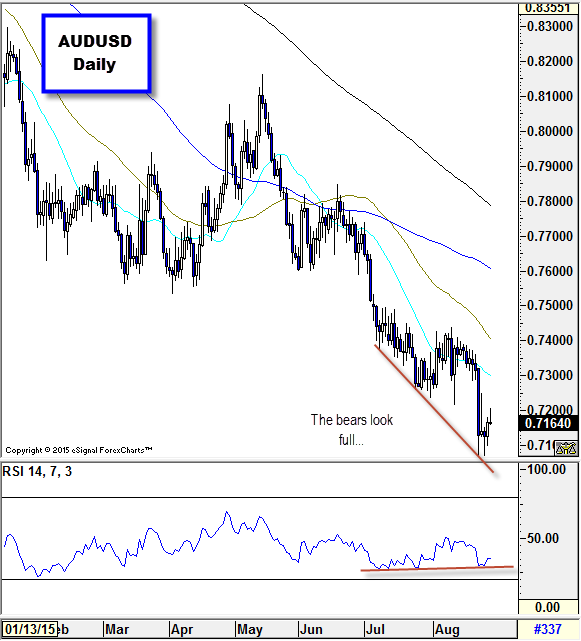
AUDUSD hovers around a six-year low
AUDUSD dropped to a new six-year low at the beginning of last week, before regaining some lost ground on Friday. There are some technical indications that the bears may be full – a short-term bullish head-and-shoulders pattern and RSI/price divergence – and the US dollar looks vulnerable to a delay in the lift-off of US interest rates. Thus, our bias is loosely higher in the near-term, but anything could happen in this data- and event-packed week.
Source: FOREX.com
Look ahead: Stocks
The Japanese stock markets closed up another 3% on Friday as its impressive kick-back rally in the second half of the week continued unabated. Sentiment has been boosted in part by the surprisingly strong upward revision in US GDP, a solid finish on Wall Street and after the release of mostly better-than-expected domestic data. Retail sales increased 1.6% year-over-year in July, the unemployment rate fell to 3.3% from 3.4% and the national core CPI measure of inflation was flat when a 0.2% drop was expected. However it wasn’t all good news as household spending unexpectedly fell 0.2%. Though there are not much Japanese data scheduled for next week, there will be plenty of macro pointers from the world’s two largest economies to look forward to. For China, the key data will be the latest manufacturing PMI. Stock market bulls will want to see a strong number obviously, but if this disappoints expectations then the Chinese hard landing fears may come back to the forefront, causing even more volatility for the Asian stock markets. In the US, it is the “NFP week.” Several employment market indicators will be released throughout the week, culminating in the official jobs report on Friday. This particular jobs report may well be the deciding factor if we are to see a 2015 rate hike. If the number comes out much stronger than expected then it is likely that the USD/JPY will rally, which in turn may boost the Nikkei as after all a stronger USD and weaker JPY is good news for Japanese exporters. However it will be interesting to see how the US markets will react as an earlier rate hike is not good news for domestic companies.So, next week could be another volatile one for the stock markets. Now, you may be wondering why we are concentrating on the Nikkei as opposed to, say, a US index, given the sheer number of high-impact US data in the week ahead. Well, part of the reason is that we are planning to write up on the US markets next week anyway. But as we are also technically-minded analysts and traders, the Nikkei chart is looking the most interesting out of all the major indices. As can be seen from the chart, the Japanese benchmark index has already formed a double top reversal pattern, which was confirmed by the breakout from the bullish channel around 20,000. From its peak of above 20900, the index went on to plummet all the way to a low of under 17200 in the space of about 2 weeks, representing a huge drop of 3,700 points or 18%. But this week the index has managed to bounce back some 2,000 points or an impressive 11% from low to peak. Will this momentum carry forward into next week? We are doubtful. After all, it is not unusual to see wild swings like these when major trends change course. Growth concerns about China are still there and the Fed may still increase interest rates later this year. There will also be plenty of buyers who may still hold large losing positions. This group of market participants may choose to exit their positions when they have the opportunity to do so. Thus, the sellers could return soon, possibly early next week. So, be wary of another leg lower across the major stock indices.
Indeed, the Japanese index has now returned to a key turning point around 19100 to 19200. This area had been strong support in the past, but now that it has been broken down it may turn into resistance. In addition to this simple support-turned-resistance area, we have the 200-day moving average also converging inside this range, at 19120. Thus, we wouldn’t be surprised if the index were to turn lower from here once again and potentially revisit or even break the lows that were hit earlier this week. However, if the bulls win the battle here, then the short-term bias would turn back bullish and a rally towards the 61.8% Fibonacci level at 19,500 or the point of origin of the breakout around 20,000 could be the most likely outcome.
Look ahead: Commodities
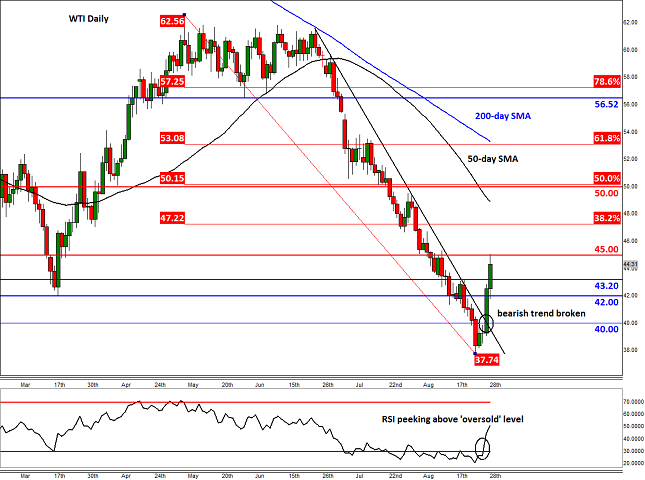
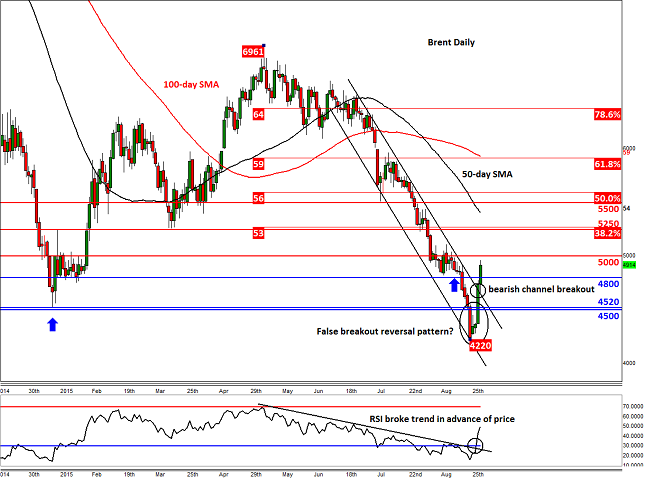
The price of crude oil surged higher on Thursday and after a brief pause extended its gains on Friday. Since hitting a low of $42.20 on Monday, Brent has risen by $7.30 to a high so for of just over $49.50. In percentage terms, it has gained a good 17%. WTI has likewise gained $7.30 from its low but because it has risen from a lower base, it has outperformed on a percentage basis – up just under 20% over the same period. From a fundamental point of view, not a lot has changed although most of the bearish news is surely now priced in. In other words, the sellers have had no reason to hold on or add to their existing positions, even if the dollar has managed to bounce back strongly. Put another way, it looks like oil prices have merely staged a short squeeze rally. For price gains to be sustained, the bulls will now want to see signs that the global supply glut is going to reduce. At the moment however, there are no such signs although the sharp 5.5-million-barrel drawdown in US crude stocks last week was a bit of a surprise. Though the weekly change in crude stockpile levels since the start of the summer has generally been negative, the magnitude of the declines has been very modest. Indeed, the most profound weekly decrease was just 6.8 million barrels in early June. Given that we are now in the twilight of the summer driving season, gasoline demand is set to fall. The usual refinery maintenance works will further reduce demand. It is thus unlikely we will see further sharp declines in crude stockpiles levels – unless many shale producers go out of business all of a sudden. But this may only happen if oil prices remain low for a long period of time. Thus, even if oil manages to extend its rally from these depressed levels, it is unlikely that we will see significantly higher prices for the foreseeable future.But in the short term, more gains could be on the way if prices manage to break some more key technical levels that are now being tested. Momentum buying alone could fuel another sharp rally. As the daily chart of Brent shows, the London-based oil contract is hovering just below resistance at $50, having already broken out of a bearish channel and horizontal resistance at $48.00 on Friday. If the sellers fail to defend this $50 hurdle then we may see the short-squeeze rally extend towards the next resistance and 38.2% Fibonacci retracement level at $52.50 or even $55 before it decides on its next move. The old resistance levels such as $48.00 and $45.00 could now turn into support should oil prices head lower. WTI meanwhile has broken its bearish trend line around $40.30 and taken out several horizontal resistances including $42.00 and $43.20 – levels that may now turn into support upon re-test. If the bulls reclaim the $45 handle then a move up to the 38.2% Fibonacci level at $47.20 or even the psychologically-important level of $50.00 will not surprise us.
Although from a fundamental point of view we think that this latest bounce in oil will not last long, we cannot ignore the fact that both contracts have created what look like false breakout reversal patterns on the daily chart i.e. the bears have failed to hold their ground below the earlier 2015 lows that were breached recently. In other words, major bottoms may have been established now – at least that’s what the charts are telling us.
Source: FOREX.com
Source: FOREX.com
Global Data Highlights
Monday, August 310100GMT – NZ ANZ Business Confidence (August)
The RBNZ noted last week that it will be a long time before the bank considers raising interest rates again, partly because of falling business confidence. ANZ’s Business Confidence Index is the most widely watched indicator of corporate sentiment in NZ, thus it can impact the NZ dollar. In July the Index dropped to -15.3, which is its lowest level in over six years.
Tuesday, September 1
0100GMT – China Manufacturing PMI (August)
China is at the forefront of investor sentiment at the moment after last week’s volatility in its stock market and recent soft private sector manufacturing figures. China’s all-important manufacturing sector is struggling from a lack of demand and economic activity; thus, sentiment is deteriorating across the board. This time around the market is expecting the official Manufacturing PMI to drop into contraction territory for the first time since February (exp. 49.7).
0130GMT – Australian building approvals (July)
A surprisingly large drop in building approvals in June raised some doubts about the housing sector which, in turn, increased the RBA’s imputes to loosen monetary policy further. While this release may take a backseat to the RBA’s policy announcement later in the day, it still could move a jittery market that’s concerned about the overall health of the Australian economy.
0145GMT – China Caixin Final Manufacturing PMI (August)
The flash numbers came as a big disappointment to the market, with the private sector gauge of Chinese manufacturing sentiment dropping to 47.1, its lowest level in over 3 years. This final headline number is expected to improve slightly to 47.3, but another drop could completely demoralize global investor sentiment.
0430GMT – RBA
The Reserve Bank of Australia is widely expected to leave the official cash rate at 2.00% this time around. In fact, all 25 economists surveyed by Bloomberg expected no change this time around, but the doves are getting louder. The recent volatility in the market, coupled with some slightly disappointing economic data, has increased the chance for further policy loosening from the RBA over the coming months. The market will be closely watching Governor Stevens’ accompanying statement for any indications that the bank has reengaged its easing bias.
0830GMT – UK Manufacturing PMI (August)
The manufacturing sector in the UK remains in expansion territory according to the latest release of manufacturing data, but new orders were down. This time around the market is expecting a slight improvement to 52.0 and it’s worth keeping an eye on what new orders are doing.
1400GMT – US ISM Manufacturing PMI (August)
In July, US manufacturers expanded at a slower pace, adding to a string of mixed numbers for factories. The sector seems to be struggling from a lack of global demand and a strong US dollar. Although, we’re expecting the ISM index to improve slightly to 52.8 in August.Tentative – NZ GDT Price Index
After falling at the prior 10 auctions, price rebounded slightly in August which is good news NZ’s all-important dairy sector. Another print in positive territory would go a long way to ease fears about the health of this part of NZ’s economy, which could improve the rates outlook in NZ.
Wednesday, September 2
0130GMT – Australian GDP (Q2)
The pace of GDP growth is a key measure of the overall performance of an economy and is therefore very closely watched by the market and policy makers. This time around the market is expecting the economy to have expanded 0.4% q/q and 2.1% y/y in Q2, down from 0.9% q/q and 2.3% y/y in the prior quarter.
1215GMT – US ADP (August)
The private sector gauge of US employment is an important mix in expectations for the all-important NFP figures. A strong print this time around may increase expectations for the headline NFP number, due out on Friday. The market is expecting a 200K increase in private employment in August.
Thursday, September 3
0130GMT - Australian retail sales and trade numbers (July)
Being an export based economy means that your trade numbers are scrutinized by the market for any signs of weakness and the health of economy at the ground level – retail sales – is also very important. This time around the market is expecting retail sales to jump a measly 0.2% m/m in July, which won’t help to dismiss any rumblings that the RBA may reduce interest rates in coming months.
1145-1230GMT – ECB
The ECB is widely expected to leave the main refinancing rate at 0.05% and deposit and lending rates at -0.2% and 0.3% respectively. The focus of the market will be on the tone of the bank and how it views the performance of the global economy and, in particular, the Eurozone.
1230GMT – US trade data (July)
The strength of the US dollar has been raising doubts about the health of the exporters and trade-exposed sectors of the economy. Even though exporters make up a small part of the US economy, they are strongly connected to the rest of the economy. This time around the market is expecting the US trade deficit to widen to 44.3bn from 43.8bn.
Friday, September 4
1230GMT – US NFP (August)
The all-important NFP report is a major factor in the setting of monetary policy in the US, hence why it can be the most-watched economic release in the world. The market is getting used to expecting a lot from these reports lately, with no one really questioning that the US labor market is heading in the right direction. However, further wage growth is key to the overall health of the economy and the outlook for interest rates. NFP expected 218K; unemployment rate exp. 5.3%; average hourly earnings exp. 0.2% m/m.
Information on these pages contains forward-looking statements that involve risks and uncertainties. Markets and instruments profiled on this page are for informational purposes only and should not in any way come across as a recommendation to buy or sell in these assets. You should do your own thorough research before making any investment decisions. FXStreet does not in any way guarantee that this information is free from mistakes, errors, or material misstatements. It also does not guarantee that this information is of a timely nature. Investing in Open Markets involves a great deal of risk, including the loss of all or a portion of your investment, as well as emotional distress. All risks, losses and costs associated with investing, including total loss of principal, are your responsibility. The views and opinions expressed in this article are those of the authors and do not necessarily reflect the official policy or position of FXStreet nor its advertisers. The author will not be held responsible for information that is found at the end of links posted on this page.
If not otherwise explicitly mentioned in the body of the article, at the time of writing, the author has no position in any stock mentioned in this article and no business relationship with any company mentioned. The author has not received compensation for writing this article, other than from FXStreet.
FXStreet and the author do not provide personalized recommendations. The author makes no representations as to the accuracy, completeness, or suitability of this information. FXStreet and the author will not be liable for any errors, omissions or any losses, injuries or damages arising from this information and its display or use. Errors and omissions excepted.
The author and FXStreet are not registered investment advisors and nothing in this article is intended to be investment advice.
Recommended Content
Editors’ Picks
AUD/USD could extend the recovery to 0.6500 and above

The enhanced risk appetite and the weakening of the Greenback enabled AUD/USD to build on the promising start to the week and trade closer to the key barrier at 0.6500 the figure ahead of key inflation figures in Australia.
EUR/USD now refocuses on the 200-day SMA

EUR/USD extended its positive momentum and rose above the 1.0700 yardstick, driven by the intense PMI-led retracement in the US Dollar as well as a prevailing risk-friendly environment in the FX universe.
Gold struggles around $2,325 despite broad US Dollar’s weakness

Gold reversed its direction and rose to the $2,320 area, erasing a large portion of its daily losses in the process. The benchmark 10-year US Treasury bond yield stays in the red below 4.6% following the weak US PMI data and supports XAU/USD.
Bitcoin price makes run for previous cycle highs as Morgan Stanley pushes BTC ETF exposure

Bitcoin (BTC) price strength continues to grow, three days after the fourth halving. Optimism continues to abound in the market as Bitcoiners envision a reclamation of previous cycle highs.
US versus the Eurozone: Inflation divergence causes monetary desynchronization

Historically there is a very close correlation between changes in US Treasury yields and German Bund yields. This is relevant at the current juncture, considering that the recent hawkish twist in the tone of the Federal Reserve might continue to push US long-term interest rates higher and put upward pressure on bond yields in the Eurozone.