- The RBNZ Launches a Prolonged Tightening Cycle
- EM Rundown: Putin on the Risk
- Market Movers: Weekly Technical Outlook
- Look Ahead: Stocks
- Look Ahead: Commodities
- Data Highlights
The RBNZ Launches a Prolonged Tightening Cycle
Last week the Reserve Bank of New Zealand (RBNZ) became the first central bank amongst its G10 counterparts to raise interest rates since 2011. The RBNZ kicked off what is expected to be a lengthy tightening cycle by raising the official cash rate (OCR) by 25bps to 2.75%, citing considerable momentum in the economy and more broad-based GDP growth. RBNZ Governor Wheeler also signaled the potential for a steeper climb in rates than previously thought, which gave investors another reason to flock to the NZ dollar.
Prior to last week, the RBNZ kept the OCR steady at 2.5% for three years in an attempt to stimulate the economy and spur growth. Now, rising house prices are driving up inflation and earthquake reconstruction efforts are providing a solid platform for GDP growth. Inflation is nearing the RBNZ’s 2% target midpoint, with consumer prices rising 1.6% last quarter, and is expected to continue to rise. At the same time, reconstruction efforts are spurring economic growth, thereby providing a near-ideal environment for tighter monetary policy. While there has been some hesitation from consumers to spend, there are signs that they should start loosening their purse strings. Overall, the NZ economy appears to be powering ahead and dealing with the recent strength of the kiwi pretty well.
Last year the NZ dollar acted as a natural handbrake to monetary policy expectations in NZ, but a high terms-of-trade seems to justify the position of the commodity currency now. Also, the strength of the NZ economy and global economic conditions have made the kiwi a more attractive investment than it otherwise would be. Hence, the RBNZ may have to accept the strength of the kiwi for the moment, and high dairy prices are offsetting some of the negative implications of a strong exchange rate.
So, in an environment where rising inflation and a strong economy are creating a recipe for tighter monetary policy, we expect interest rates to rise in NZ at a fairly rapid pace. The projections of the RBNZ suggest that interest rates may rise 100-125bps this year and breach 5% in 2017. This is clearly a very hawkish stance, but we can see the bank becoming even more aggressive with monetary policy, albeit not by much.
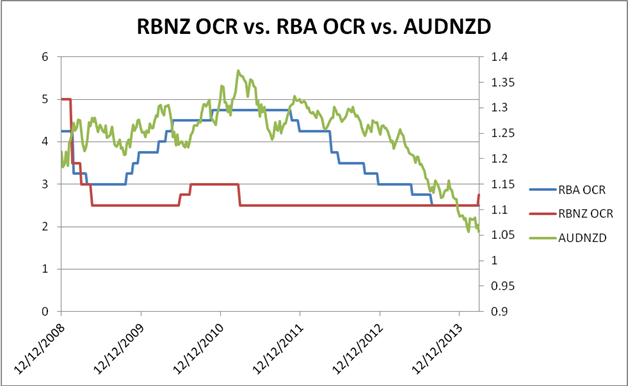
Next month we think the RBNZ will follow up this month’s rate rise with another 25bps increase in the OCR. From there, the exact future pace of rate rises may depend on the level of the exchange rate, as well as the strength of domestic economic data and inflation. By the end of the year we think the OCR could be around 3.75%, which is slightly higher than market expectations. If this comes to fruition, the kiwi may continue to be protected on the downside and a favorite commodity currency. This may see AUDNZD make a run for parity. As is evident from the chart below, the divergence of interest rates between NZ and Australia has been a major factor in the deterioration of AUDNZD.
Figure 1:
Source: FOREX.com, Bloomberg
EM Rundown: Putin on the Risk
Risk sentiment took a big turn for the worse on Thursday as the tensions between Russia and Ukraine escalated further ahead of this weekend’s Crimean secession vote. News that the Russian military was massing forces on the border of eastern Ukraine stoked concerns that the Mother Country could intervene into the ethnically Russian region of Eastern Ukraine next. In response, NATO announced that it would deploy its own fighter jets on Ukraine’s western border. The “war of the words” also intensified this week, with German Chancellor Merkel, US President Obama, and other Western leaders vowing to enact economic sanctions on Monday if Russia does not back down. For now, Germany and the rest of Western Europe remain hesitant to adopt sanctions on Russia, perhaps due to their reliance on Russian oil.
One possibility is that Russia may be engaging in a show of force so that it can use the recently gathered troops around the Eastern Ukraine border as a negotiating chip. If Putin is able to exchange a pullback of those troops for some benefit from the West and Ukraine, it would make the annexation of Crimea more of a foregone conclusion.
Regardless of the countries’ motives, traders took the heightened geopolitical risks as an opportunity to lighten up on risky trades ahead of the weekend. In classic risk-off fashion, global equities and higher-yielding currencies fell, while traditional “safe havens” like gold, government bonds, and the Japanese yen rose heading into week’s close. Barring any miraculous diplomatic breakthrough, Sunday’s secession vote in Crimea appears likely to take place as scheduled, potentially keeping risk aversion in play throughout next week as traders look anxiously ahead to the Russian Parliament’s debate on whether to accept Crimea into the Russian Federation next Friday (March 21).
The regional emerging market currencies were most affected by this situation with the Russian ruble, Ukrainian hryvnia, Turkish lira (which is struggling with its own political issues), Polish zloty, and Hungarian forint all falling against the U.S. dollar last week. Crucially for G10 traders, the escalating clash has been a major driver of “safe haven” demand for the Japanese yen and Swiss Franc.
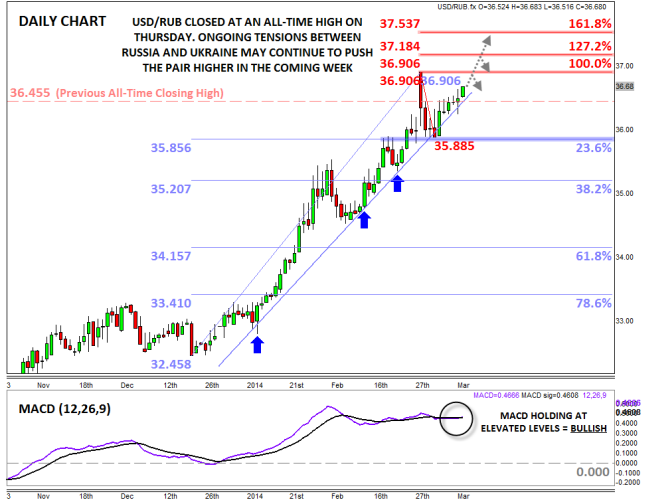
For this week, the USD/RUB exchange rate may serve as a proxy for the market’s concern with the developing conflict as a whole. The pair closed at an all-time high on Thursday, above the Great Financial Crisis closing peak at 36.455. The fact that the uptrend resumed off the extremely shallow 23.6% Fibonacci retracement two weeks ago suggests that buyers remain firmly in control of trade, as does the elevated MACD indicator. As long as tensions remain elevated, the unit may continue to rally toward the all-time intraday highs at 36.90. Above that level, bulls may look to press the pair up to test near-term Fibonacci extension levels at 37.18 (127.2%) and 37.54 (161.8%). Meanwhile, only a break back below the multi-month bullish trend line would shift the bias back to neutral for this week.
Figure 2:
Source: FOREX.com
Market Movers: Weekly Technical Outlook
Technical Developments to Watch:
- EUR/USD holding just above key 1.3825 level
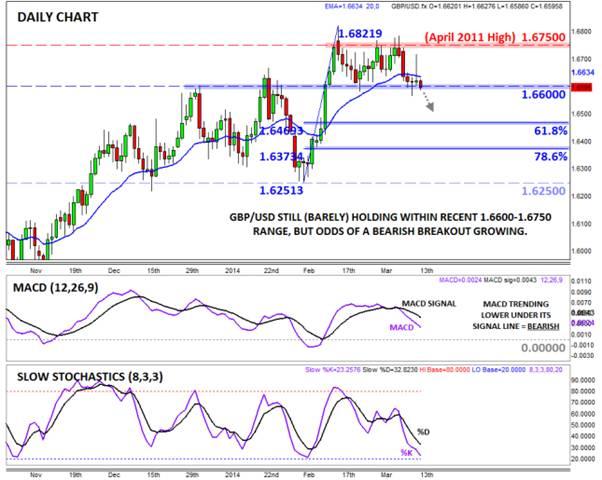
- GBP/USD still within 1.6600-1.6750 range, but bearish break increasingly likely
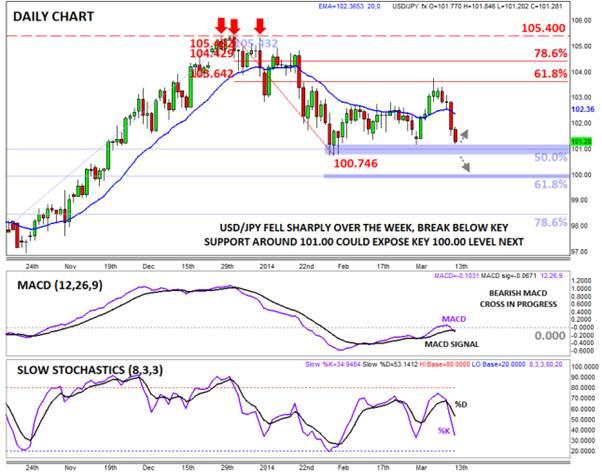
- USD/JPY nearing key 101.00 support, break below could target 100.00 next
- EUR/GBP in play, early week pullback possible
EUR/USD
- EUR/USD inched toward 1.40 before reversing sharply Thursday
- MACD continues to show bullish momentum
- Break below previous-resistance-turned-support at 1.3825 would erase bullish bias
The EUR/USD made a run for the key 1.40 level midweek, but ECB President Draghi’s warning on the high value of the currency led to a big reversal on Thursday. From a candlestick perspective, this price action created a Dark Cloud Cover* candlestick, though the bias still remains generally bullish above the previous-resistance-turned support at 1.3825. As of writing, the MACD continues to show bullish momentum, and the Slow Stochastics have pulled back from overbought territory, potentially opening the door for another leg higher if 1.3825 support holds. On the other hand, a break below 1.3825 would shift the bias back to neutral for this week.
*A Dark Cloud Cover is formed when one candle opens near the top of the previous candle's range, but sellers step in and push rates down to close in the lower half of the previous candle's range. It suggests a potential trend reversal.
GBP/USD
- GBP/USD bounced around within 1.6600-1.6750 range
- MACD turning lower, indicating shift to bearish momentum
- Bias remains neutral in current range, but recent price action favors a downside breakout
The key 1.6600-1.6750 consolidation zone highlighted in last week’s report held up for another week despite an outbreak of intraweek volatility. The GBP/USD traversed that entire range twice over the course of last week’s trade, but rates are still trapped within that zone as we go to press. Meanwhile, the MACD has now started to trend lower below its signal line, an indication of bearish momentum in the pair and a sign that the risk is shifting toward a downside breakout this week. A drop below 1.6600 may expose the 61.8% or 78.6% Fibonacci retracements at 1.6470 and 1.6370 respectively.
USD/JPY
- USD/JPY fell sharply last week
- MACD turning lower, about to cross its signal line
- Approaching key support around 101.00, but a break below may expose key 100.00 level
The USD/JPY collapsed last week on general risk aversion, dropping over 220 pips peak-to-trough on the week. As of Friday’s European close, the pair is approaching key previous support around the 101.00 level, an area that has twice put a floor under rates this year. Meanwhile, the MACD is rolling back over after testing the “0” level for the first time since January, indicating a possible shift back to bearish momentum. For this week, all eyes will be on the 100.75-101.20 support zone, and if bulls are unable to defend that floor, the USD/JPY may fall down to test the psychologically significant 100.00 level next.
General Risk Warning for stocks, cryptocurrencies, ETP, FX & CFD Trading. Investment assets are leveraged products. Trading related to foreign exchange, commodities, financial indices, stocks, ETP, cryptocurrencies, and other underlying variables carry a high level of risk and can result in the loss of all of your investment. As such, variable investments may not be appropriate for all investors. You should not invest money that you cannot afford to lose. Before deciding to trade, you should become aware of all the risks associated with trading, and seek advice from an independent and suitably licensed financial advisor. Under no circumstances shall Witbrew LLC and associates have any liability to any person or entity for (a) any loss or damage in whole or part caused by, resulting from, or relating to any transactions related to investment trading or (b) any direct, indirect, special, consequential or incidental damages whatsoever.
Recommended Content
Editors’ Picks
AUD/USD risks a deeper drop in the short term

AUD/USD rapidly left behind Wednesday’s decent advance and resumed its downward trend on the back of the intense buying pressure in the greenback, while mixed results from the domestic labour market report failed to lend support to AUD.
EUR/USD leaves the door open to a decline to 1.0600

A decent comeback in the Greenback lured sellers back into the market, motivating EUR/USD to give away the earlier advance to weekly tops around 1.0690 and shift its attention to a potential revisit of the 1.0600 neighbourhood instead.
Gold is closely monitoring geopolitics

Gold trades in positive territory above $2,380 on Thursday. Although the benchmark 10-year US Treasury bond yield holds steady following upbeat US data, XAU/USD continues to stretch higher on growing fears over a deepening conflict in the Middle East.
Bitcoin price shows strength as IMF attests to spread and intensity of BTC transactions ahead of halving

Bitcoin (BTC) price is borderline strong and weak with the brunt of the weakness being felt by altcoins. Regarding strength, it continues to close above the $60,000 threshold for seven weeks in a row.
Is the Biden administration trying to destroy the Dollar?

Confidence in Western financial markets has already been shaken enough by the 20% devaluation of the dollar over the last few years. But now the European Commission wants to hand Ukraine $300 billion seized from Russia.


