Russian Fighter Jet Shot Down by Turkey; Risk Trade is No More:
Once upon a time, if a world super power on the brink of war had a fighter jet shot down after entering the airspace of another sovereign nation for barely a few seconds, all hell would break loose in markets and risk-off would reign supreme sending stocks tumbling. Not any more.
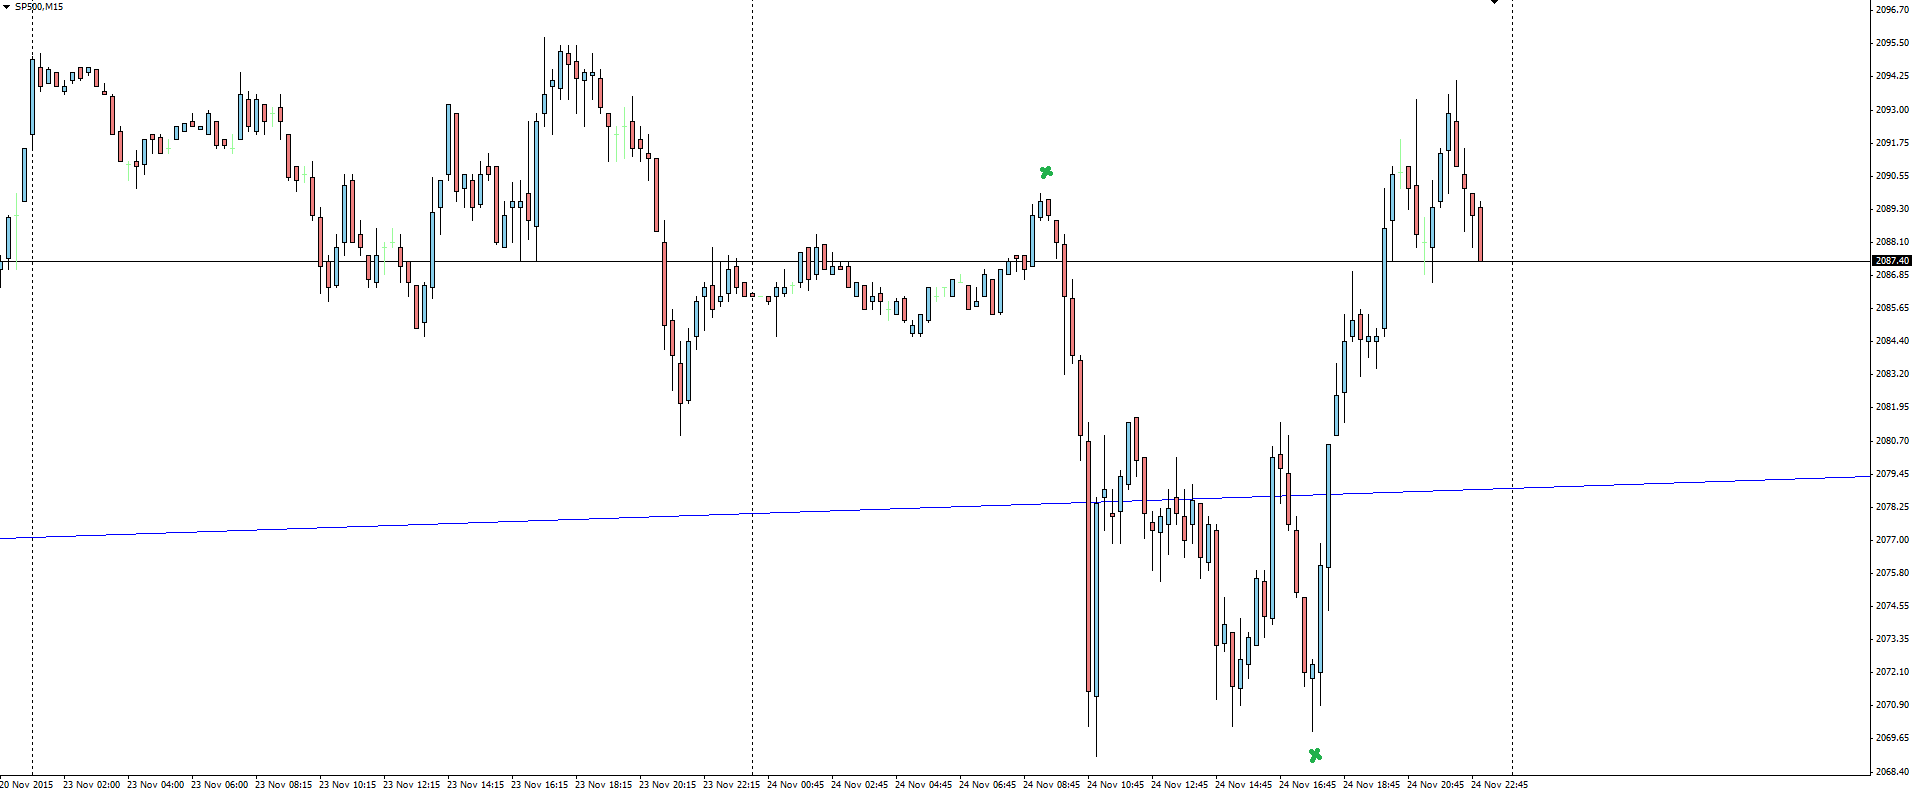
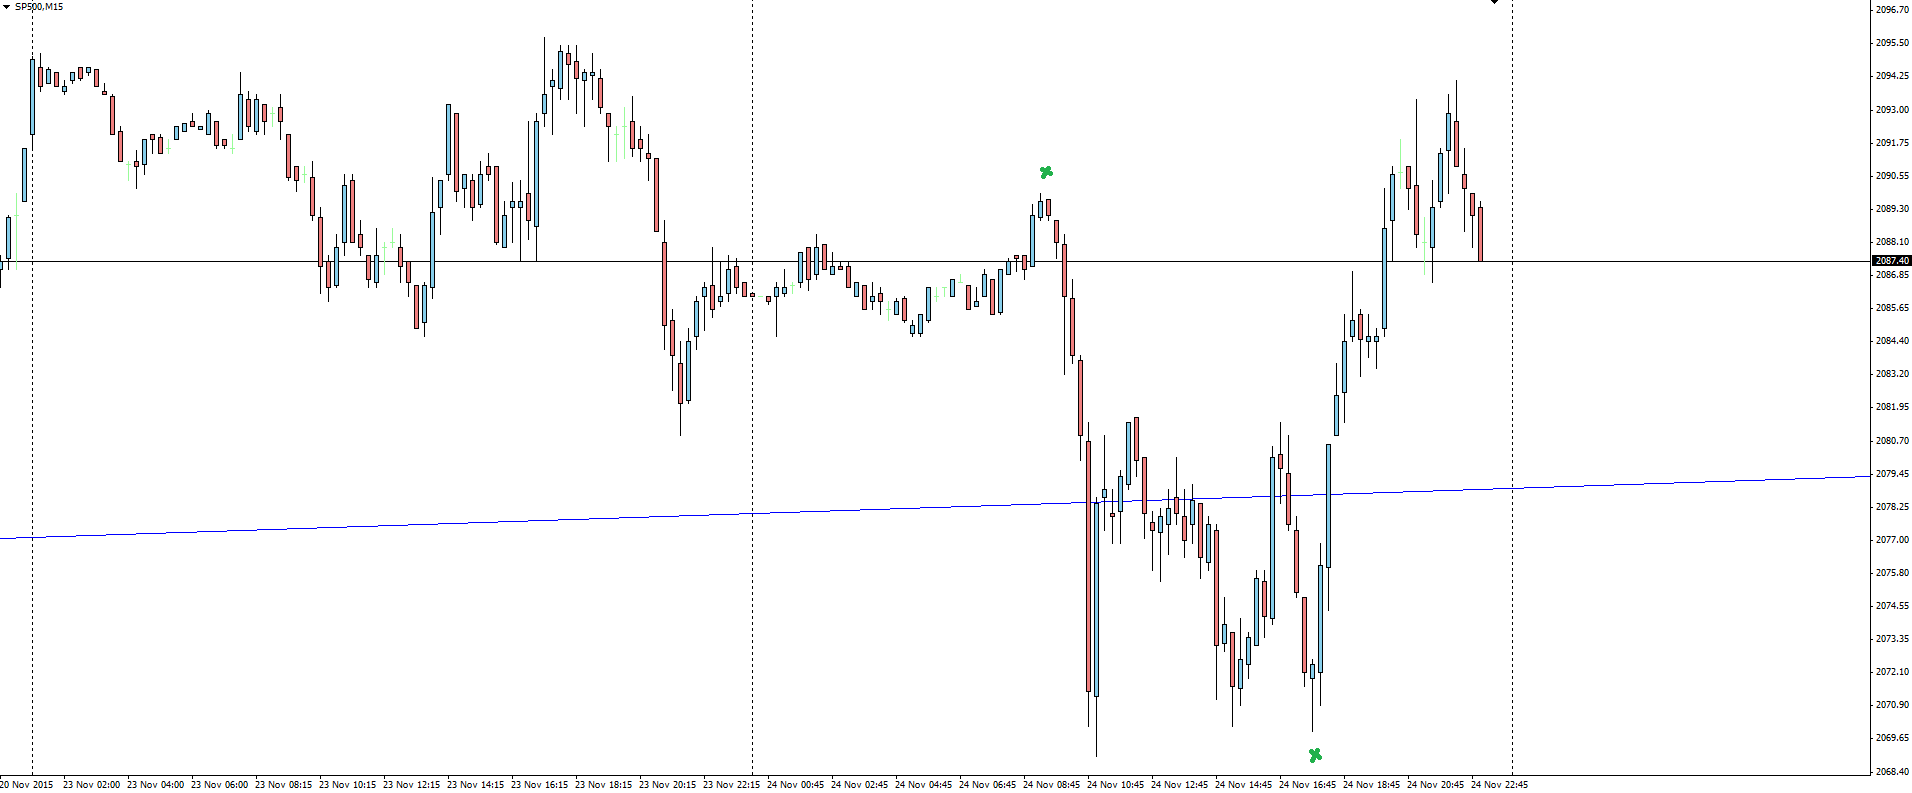
SP500 15 Minute:
The news of the Russian fighter jet being spectacularly grounded in a ball of flames saw only a mild spike down in the SP500 during early trade, but that was only a short lived move and quickly erased losses to actually close well in the green for the session. Amazing!
So just to make it absolutely clear, if you want to be a successful trader, DO NOT listen to the textbook definitions of what should or should not happen to markets during times of geopolitical risk. Times have changed and so have the perceptions that markets take on events like these.
I felt almost dirty saying it last week following the Paris attacks and again it doesn’t feel right saying it again, but as a trader it has to be said:
“Markets are slowly becoming more and more immune to these types of events.”
Aussie Rips:
RBA Governor Stevens’ speech also helped push the Aussie to new highs overnight. Speaking at a dinner in Sydney, Stevens’ gave markets the one key quote that mattered, establishing the bank’s stance is firmly neutral.
“Lower rates were not as stimulatory as they used to be.”
That is not the type of thing that someone looking to cut any time soon would say.
AUD/USD Daily:
The Aussie catches a bid and tucks back above the hugely important weekly trend line again.
On the Calendar Wednesday:
JPY Monetary Policy Meeting Minutes
AUD Construction Work Done q/q
AUD RBA Assist Gov Debelle Speaks
GBP Autumn Forecast Statement
USD Core Durable Goods Orders m/m
USD Unemployment Claims
Chart of the Day:
Following the news of the Russian fighter jet being shot down and it’s effect on the SP500, today’s chart of the day moves across to AUD/JPY.
AUD/JPY is often regarded as being highly correlated to the SP500, something you can check for yourself with the ‘Correlation Matrix’ in our Vantage FX Smart Trader Tools add-on for MT4. The pair tends to find buyers when markets go risk-on, while sellers enter when the environment turns to risk-off.
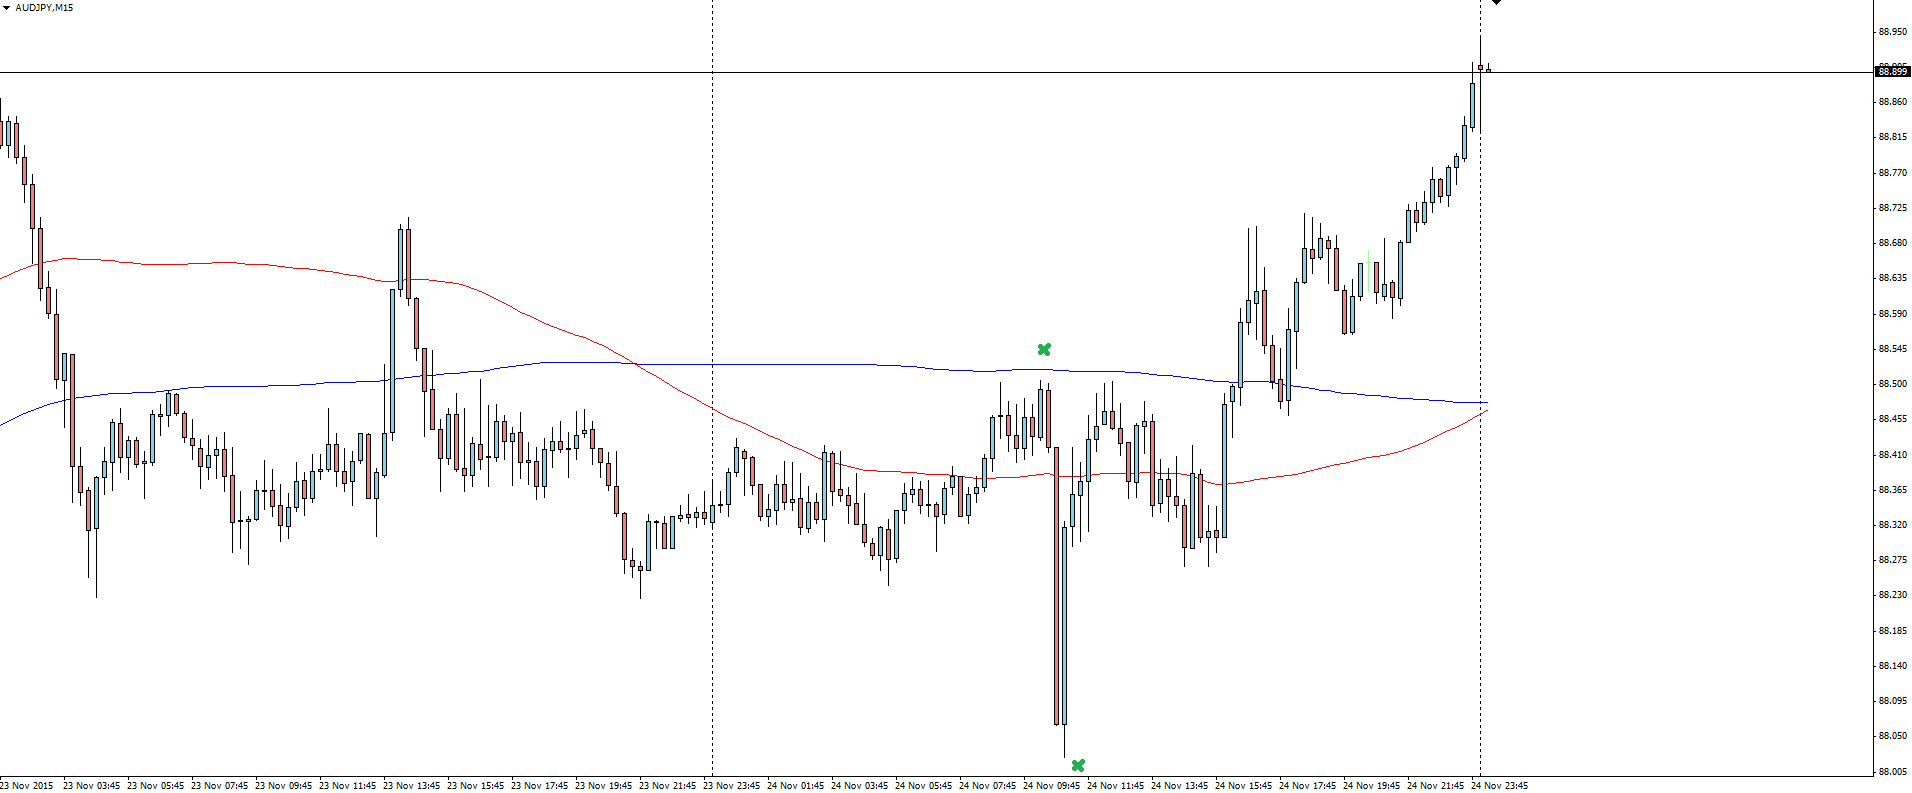
AUD/JPY 15 Minute:
Compare the 15 minute AUD/JPY chart here with the above SP500 chart we featured at the top of this blog and the correlation is clear on the plane spike, with the pair dropping but then immediately rallying hard as the market determines the event to just about be today’s normal.
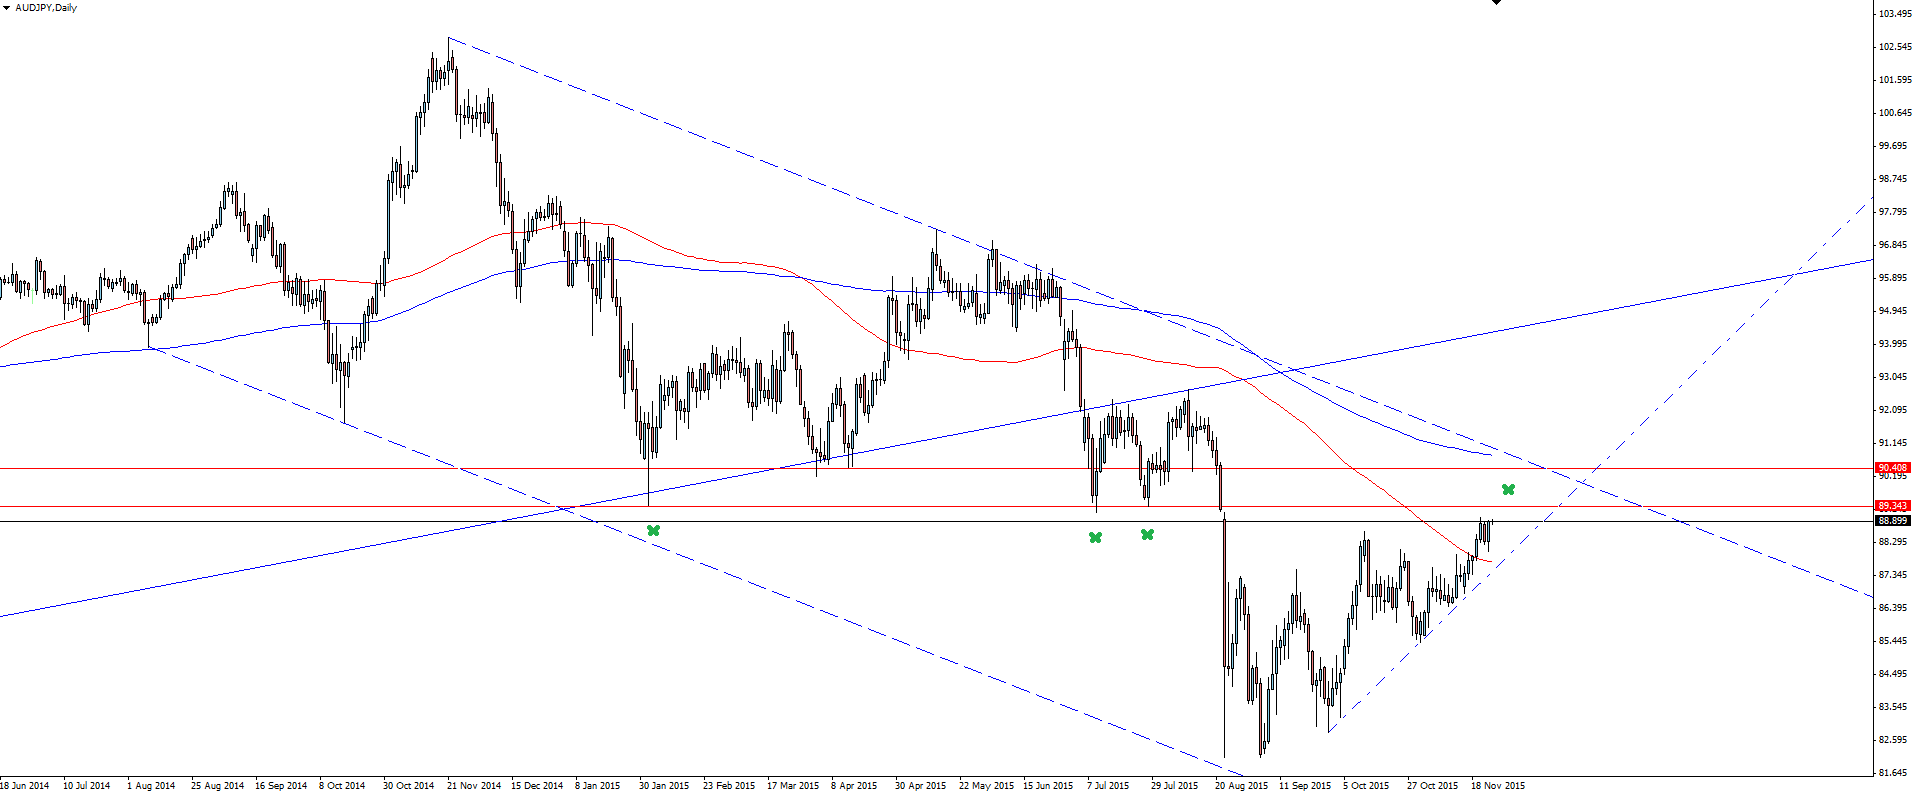
AUD/JPY Daily:
Zooming out to the daily and we can see that price smashed through the 100 SMA that we were watching last week, and looks like it is reaching for channel resistance. I have re-drawn the horizontal support/resistance line to take in the spikes and we now have a nice confluence of possible resistance from which to take trades from.
In addition to the website disclaimer below, the material on this page prepared by Vantage FX Pty Ltd does not contain a record of our prices or solicitation to trade. All opinions, news, research, tools, prices or other information is provided as general market commentary and marketing communication – not as investment advice. Consequently, any person acting on it does so entirely at their own risk. The expert writers express their personal opinions and will not assume any responsibility whatsoever for the forex trading account of the reader. We always aim for maximum accuracy and timeliness, and Vantage FX shall not be liable for any loss or damage, consequential or otherwise, which may arise from the use or reliance on this service and its content, inaccurate information or typos. No representation is being made that any results discussed within the report will be achieved, and past performance is not indicative of future performance.sary.
Recommended Content
Editors’ Picks
AUD/USD failed just ahead of the 200-day SMA

Finally, AUD/USD managed to break above the 0.6500 barrier on Wednesday, extending the weekly recovery, although its advance faltered just ahead of the 0.6530 region, where the key 200-day SMA sits.
EUR/USD met some decent resistance above 1.0700

EUR/USD remained unable to gather extra upside traction and surpass the 1.0700 hurdle in a convincing fashion on Wednesday, instead giving away part of the weekly gains against the backdrop of a decent bounce in the Dollar.
Gold keeps consolidating ahead of US first-tier figures

Gold finds it difficult to stage a rebound midweek following Monday's sharp decline but manages to hold above $2,300. The benchmark 10-year US Treasury bond yield stays in the green above 4.6% after US data, not allowing the pair to turn north.
Bitcoin price could be primed for correction as bearish activity grows near $66K area

Bitcoin (BTC) price managed to maintain a northbound trajectory after the April 20 halving, despite bold assertions by analysts that the event would be a “sell the news” situation. However, after four days of strength, the tables could be turning as a dark cloud now hovers above BTC price.
Bank of Japan's predicament: The BOJ is trapped

In this special edition of TradeGATEHub Live Trading, we're joined by guest speaker Tavi @TaviCosta, who shares his insights on the Bank of Japan's current predicament, stating, 'The BOJ is Trapped.'


