In this article we will look at several markets from the Elliott wave perspective. Where those markets sit right now, and where the wave principle suggests they might be going in the future.
I will take a 'wide angle' view of the wave forms to give you a sense of the medium to long term outlook,
You can then factor this outlook into your own trading. and as the weeks go on I will zoom in on the shorter term action.
So today I will analyse,
- EURUSD
- GBPUSD
- GOLD
- DJIA
- CRUDE OIL
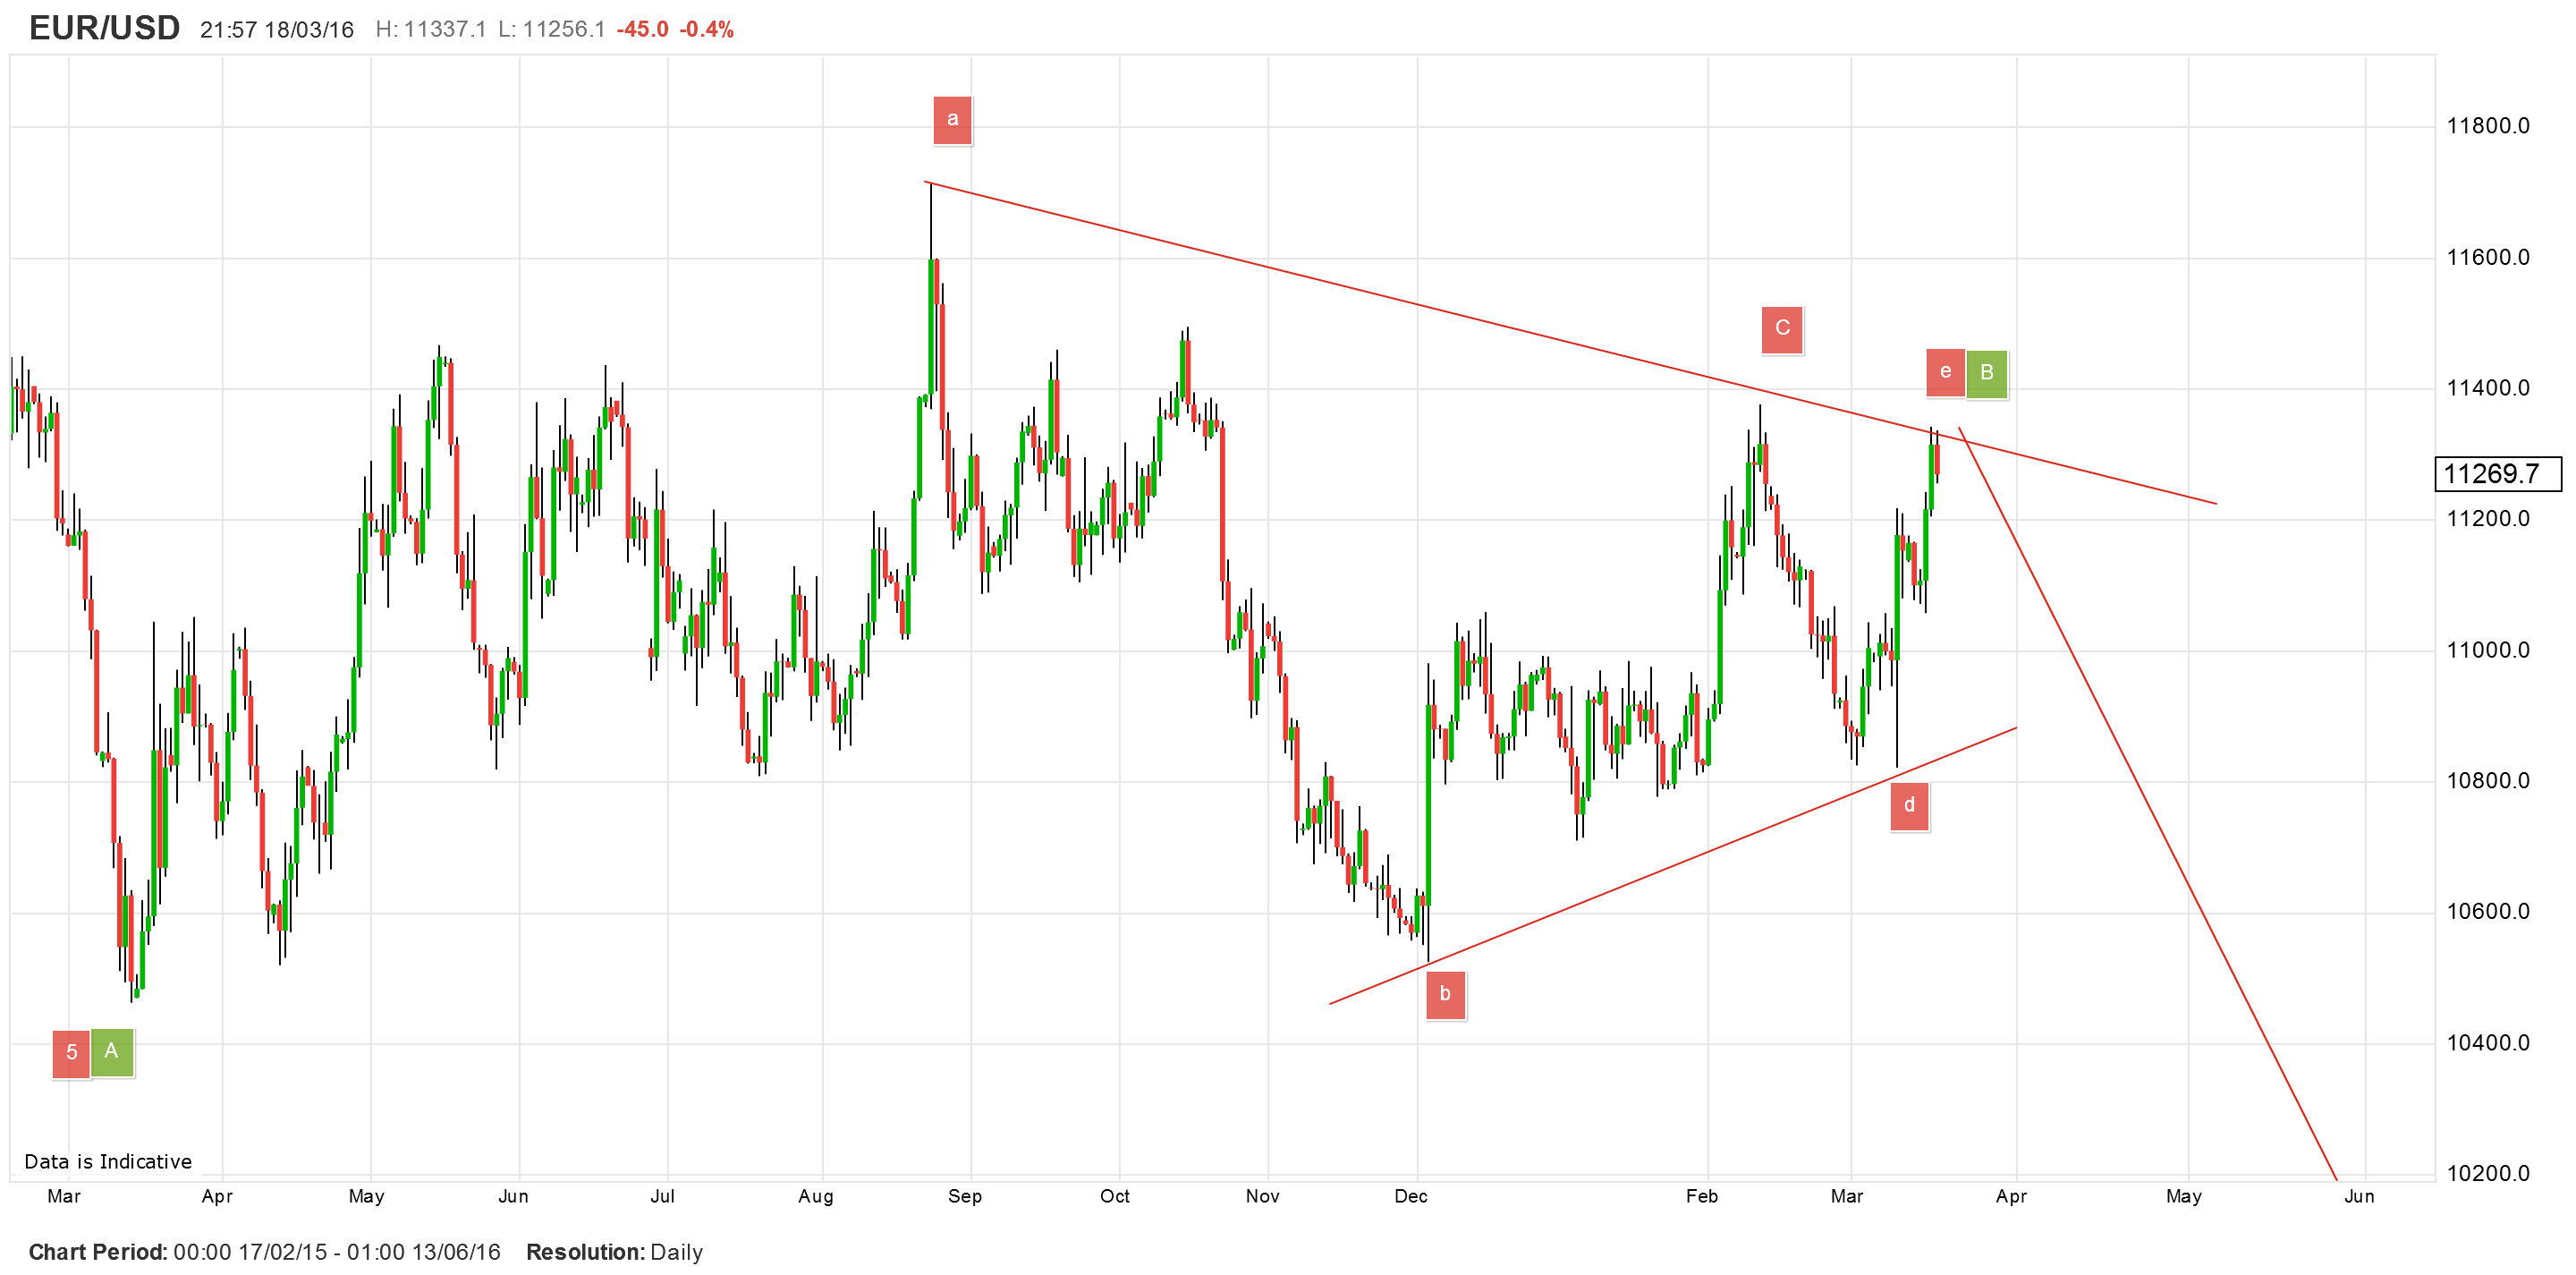
The last 12 months have seen a very large correction unfold. This Elliott wave pattern is called a contracting triangle
As always corrections are notoriously hard to trade and this one has been no different. BUT,
We are drawing very close to the completion of this pattern and it suggests some explosive moves ahead for this pair.
The first thing to note is this, a contracting triangle is a corrective move within the larger trend. It has 5 internal waves labelled a,b,c,d,e. These waves have been labelled as complete in the chart above.
And once these 5 'waves' can be called complete, then we can look for the larger trend to continue.
The larger trend in the EURUSD case is DOWN and I am looking firmly lower for the rest of the year given the larger trend we are in.
The Most important price level within this wave count is the high labelled wave C at 11376.7, if this high is broken the we will have to revisit this count. but as it stands the outlook is negative to possible all time lows.
I have sold the pair at 11282 on Thursday, with my stop place at the Wave C high.
This market should get interesting quite soon.
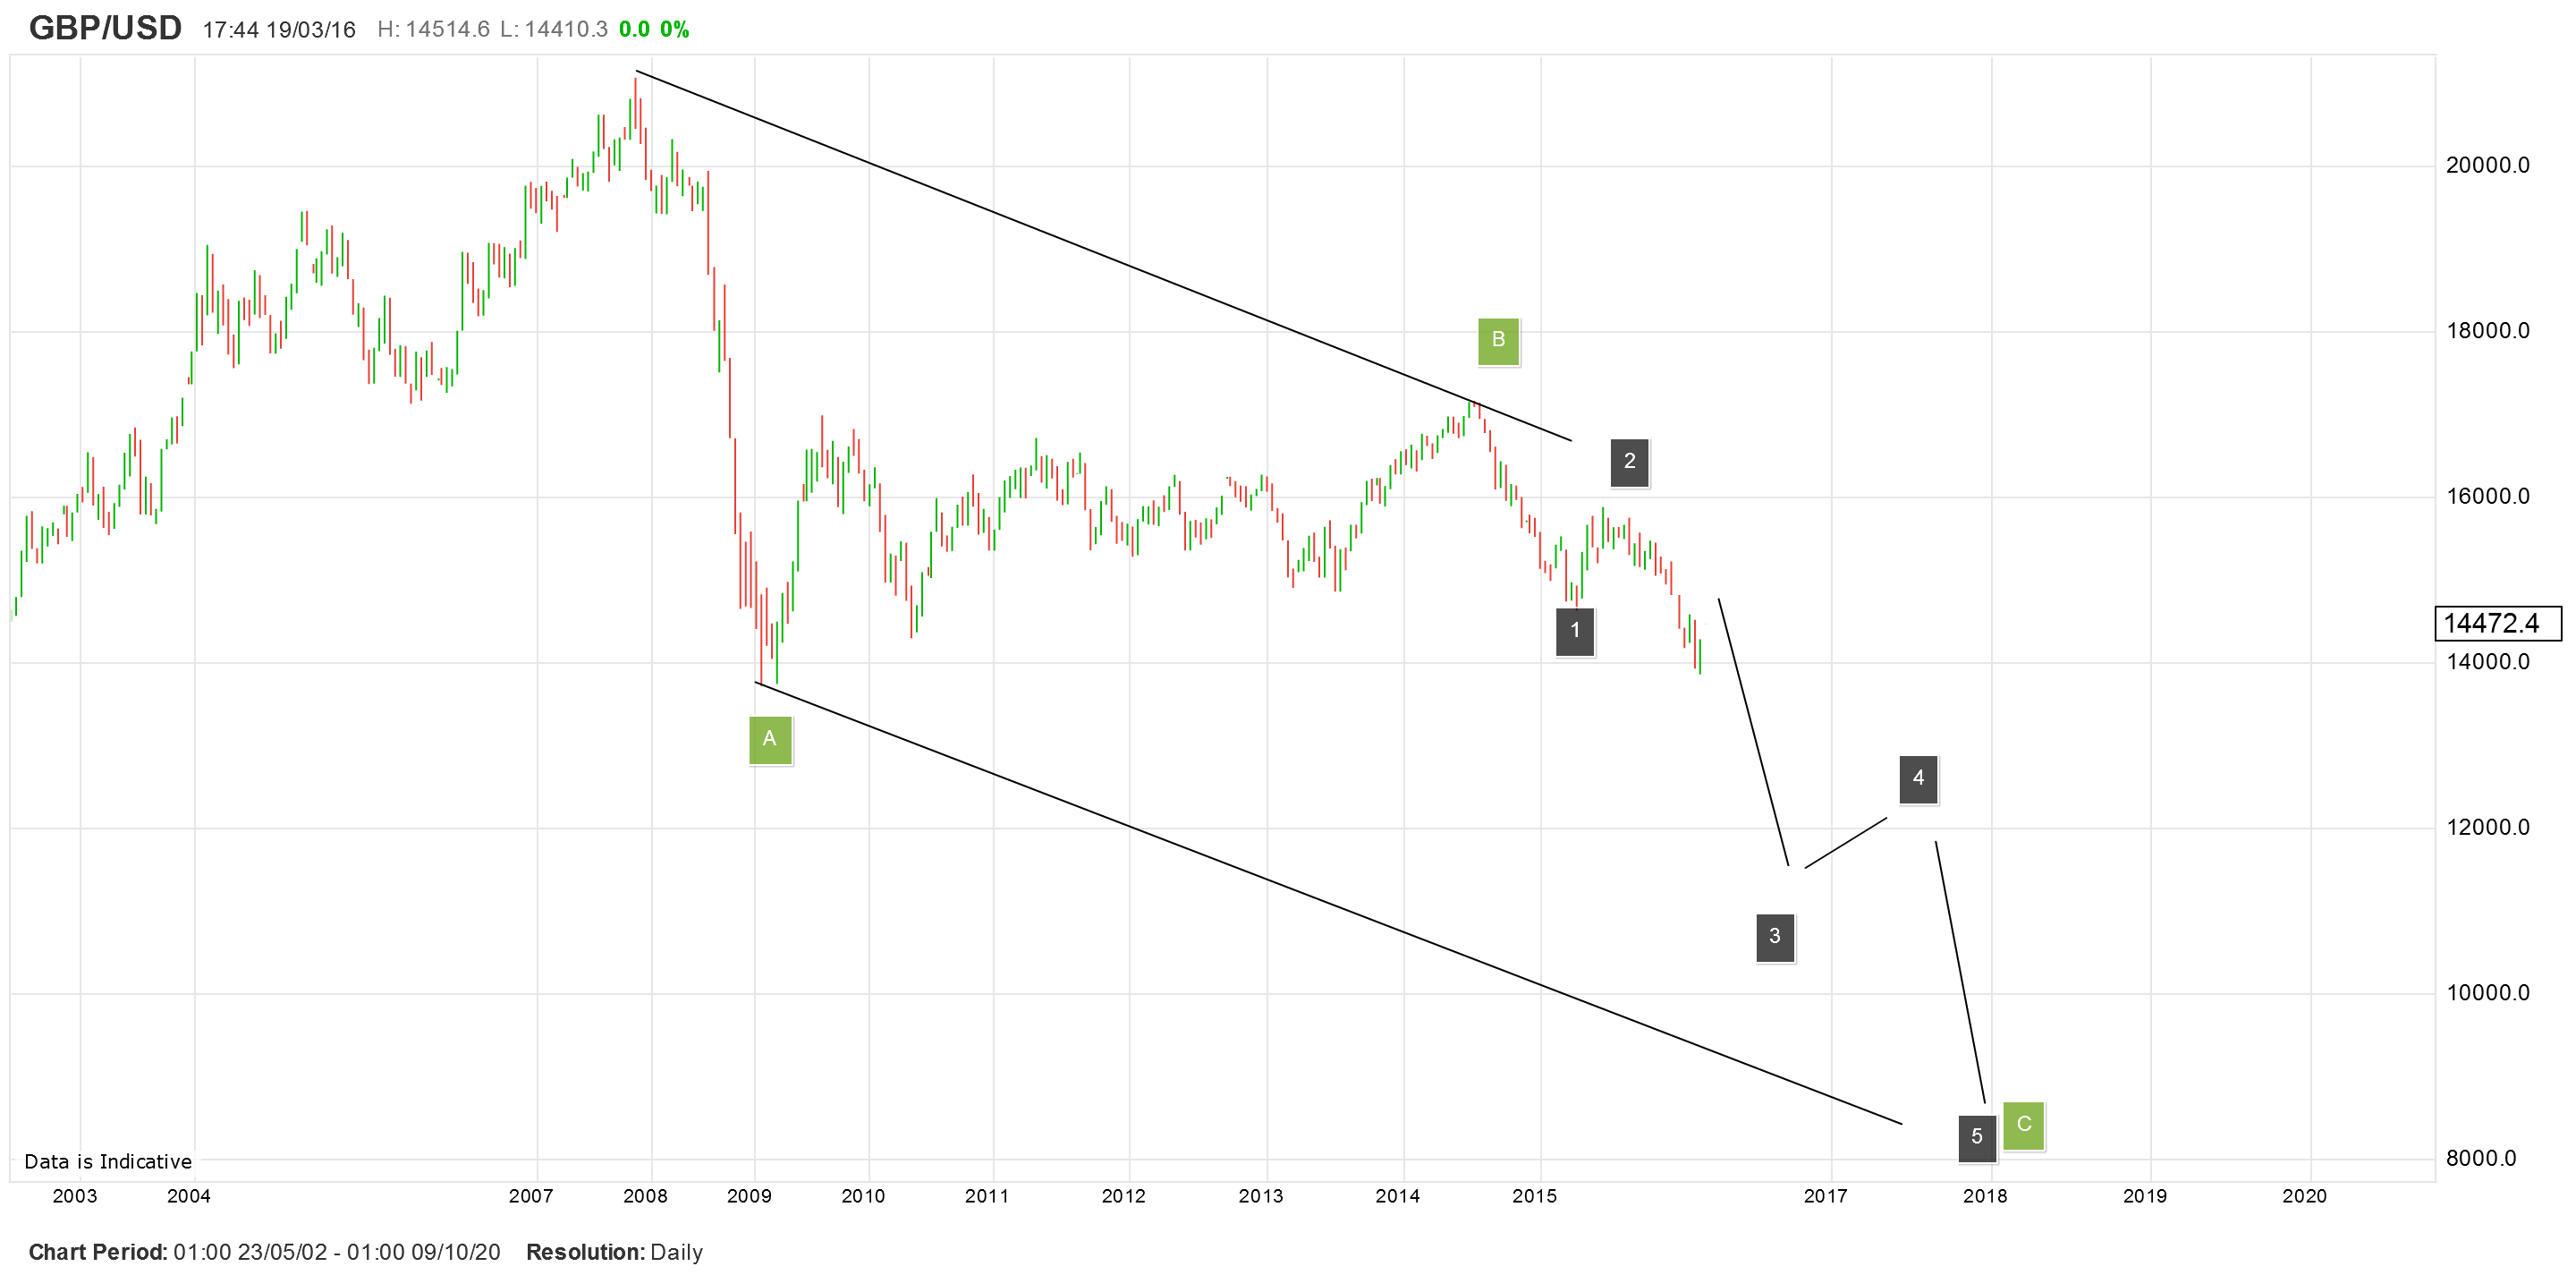
According to the wave count, the pound began a very large move to the downside beginning in September 2015.
The next leg down should bring the pair to parity at the least!
From an Elliot wave perspective this will all be part of a large 3 wave correction to the downside dating back to the highs of late 2007. the overall pattern will unfold in 3 waves labelled A,B,C (in green)
The final C wave down, should consist of 5 distinct moves labelled 1 through 5.
The price seems to have begun wave '3' of wave C down, and it should be quite powerful.
If we get a corrective move up in the next few weeks I will be looking to take advantage on the short side.
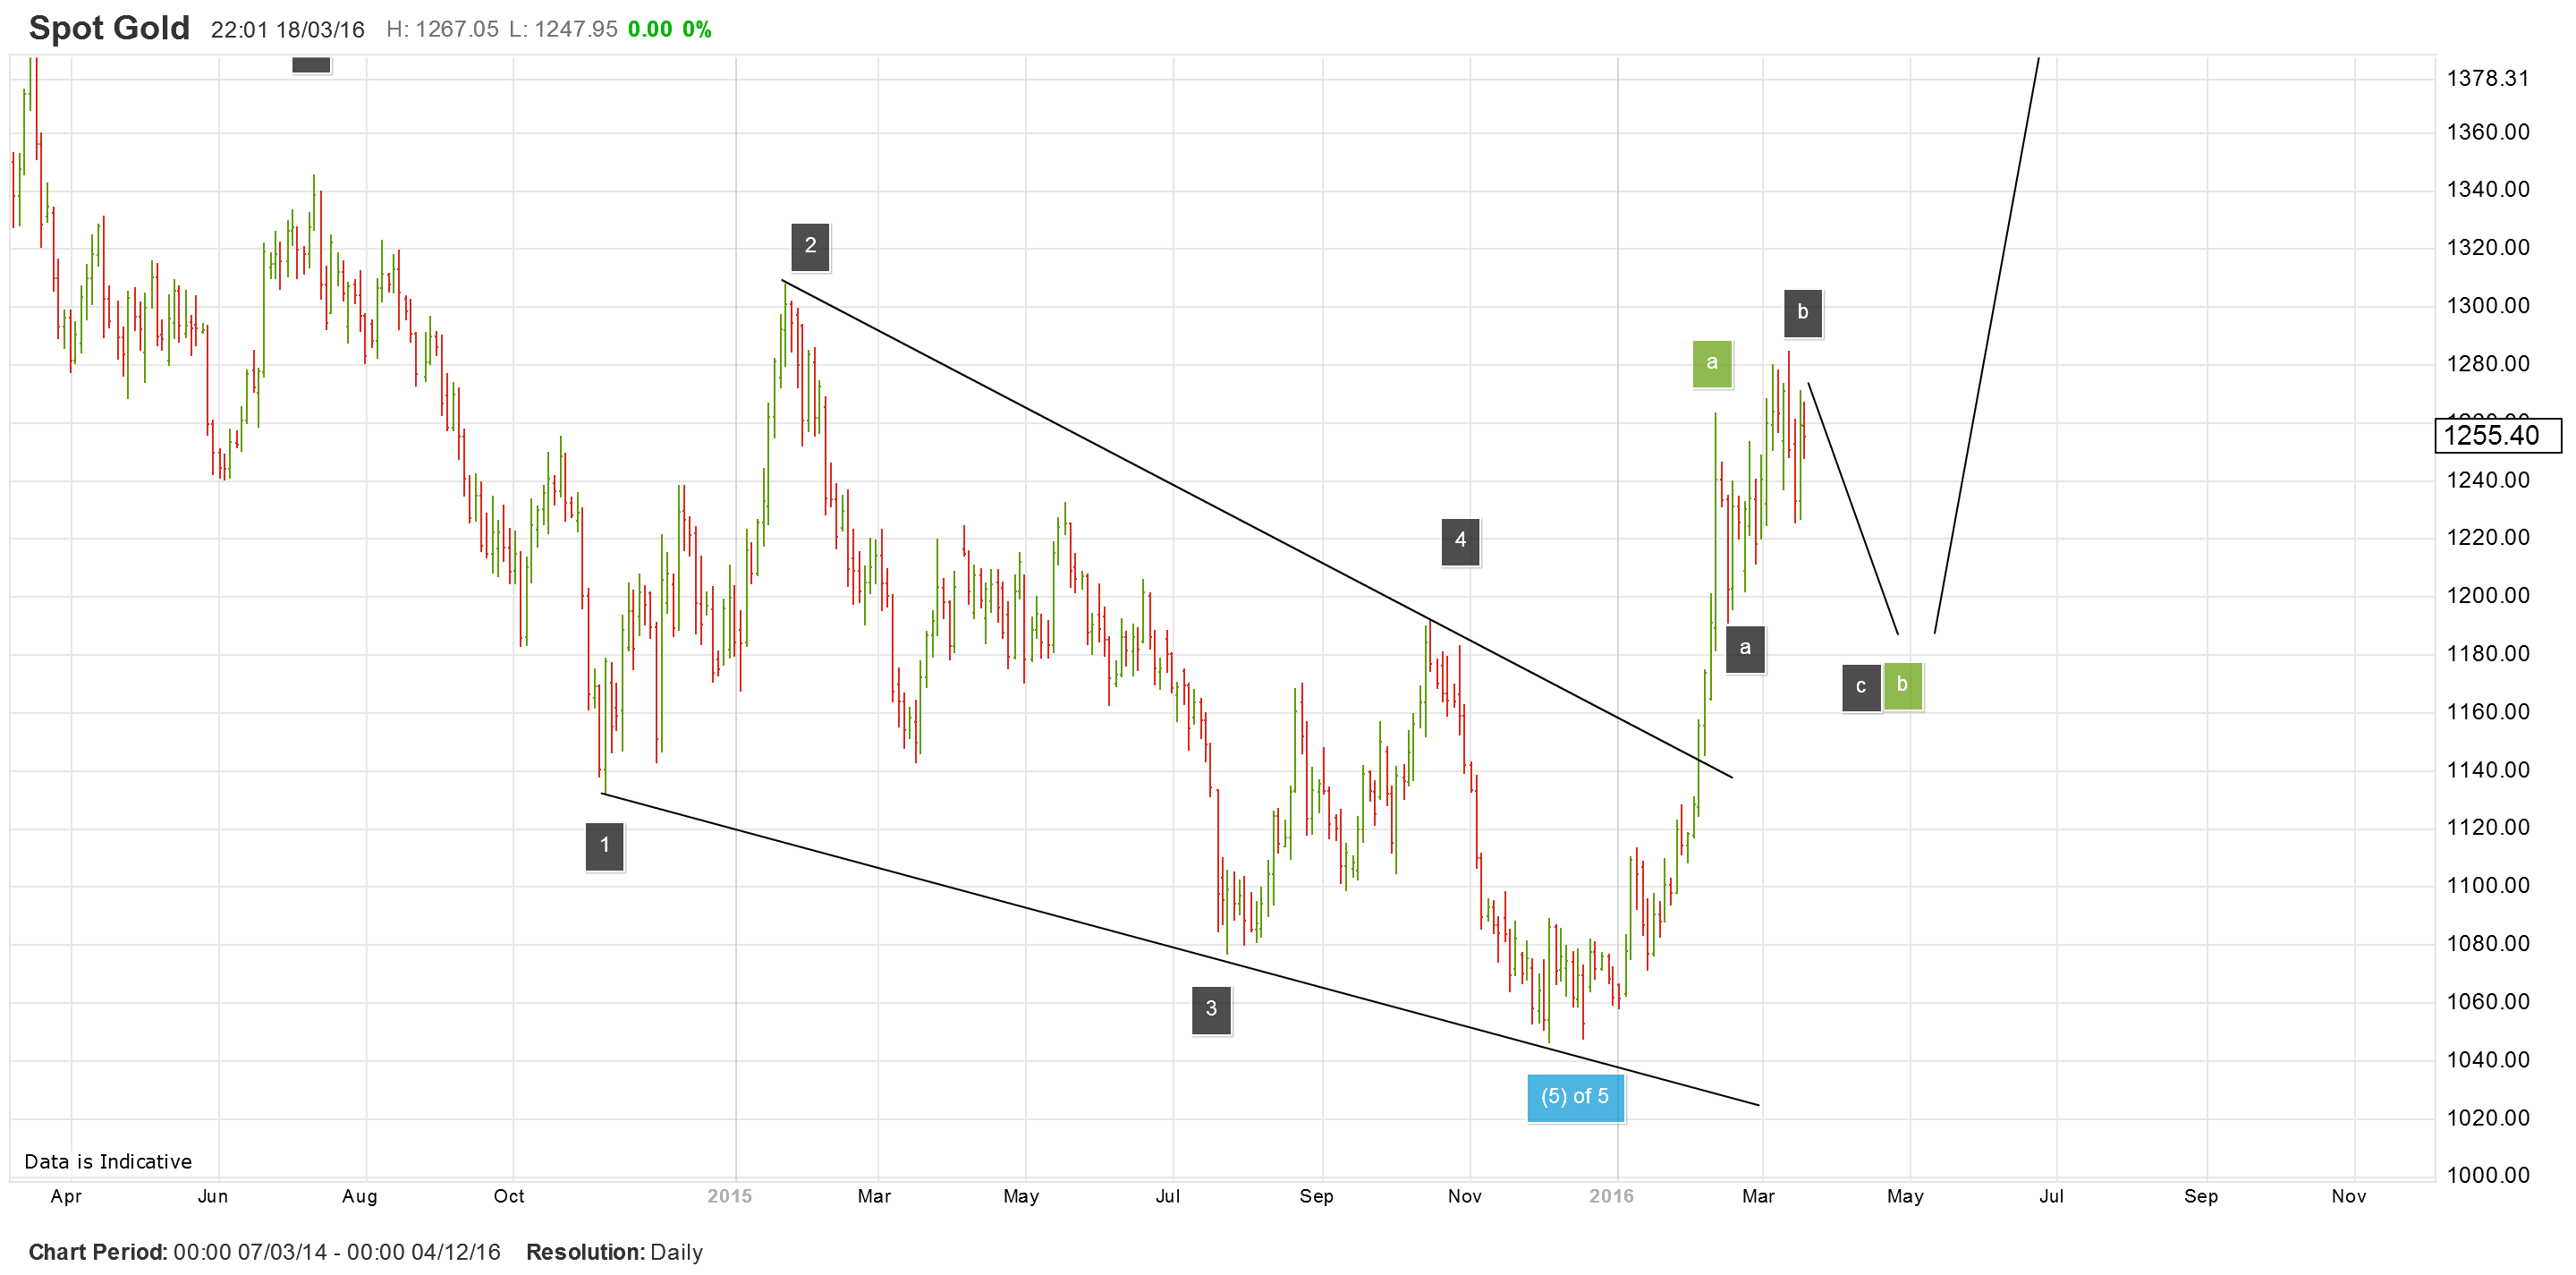
The explosive moves to the upside in Gold of late are part of an upward correction which could continue to around the $1400 area.
This correction will take a 3 wave form, labelled A,B,C above (in green). It looks like wave A up is Complete, and we are now in the middle of the B wave which should bring prices back to the 1180 handle.
Once the B wave is complete, it will offer us a very nice buying opportunity. hold off for now, no one likes to buy a top!
Again this is a wide angle perspective!
Lets cast our minds back to 2009. The march low of that year marked the end of a 3 wave correction from the year 2000 top.
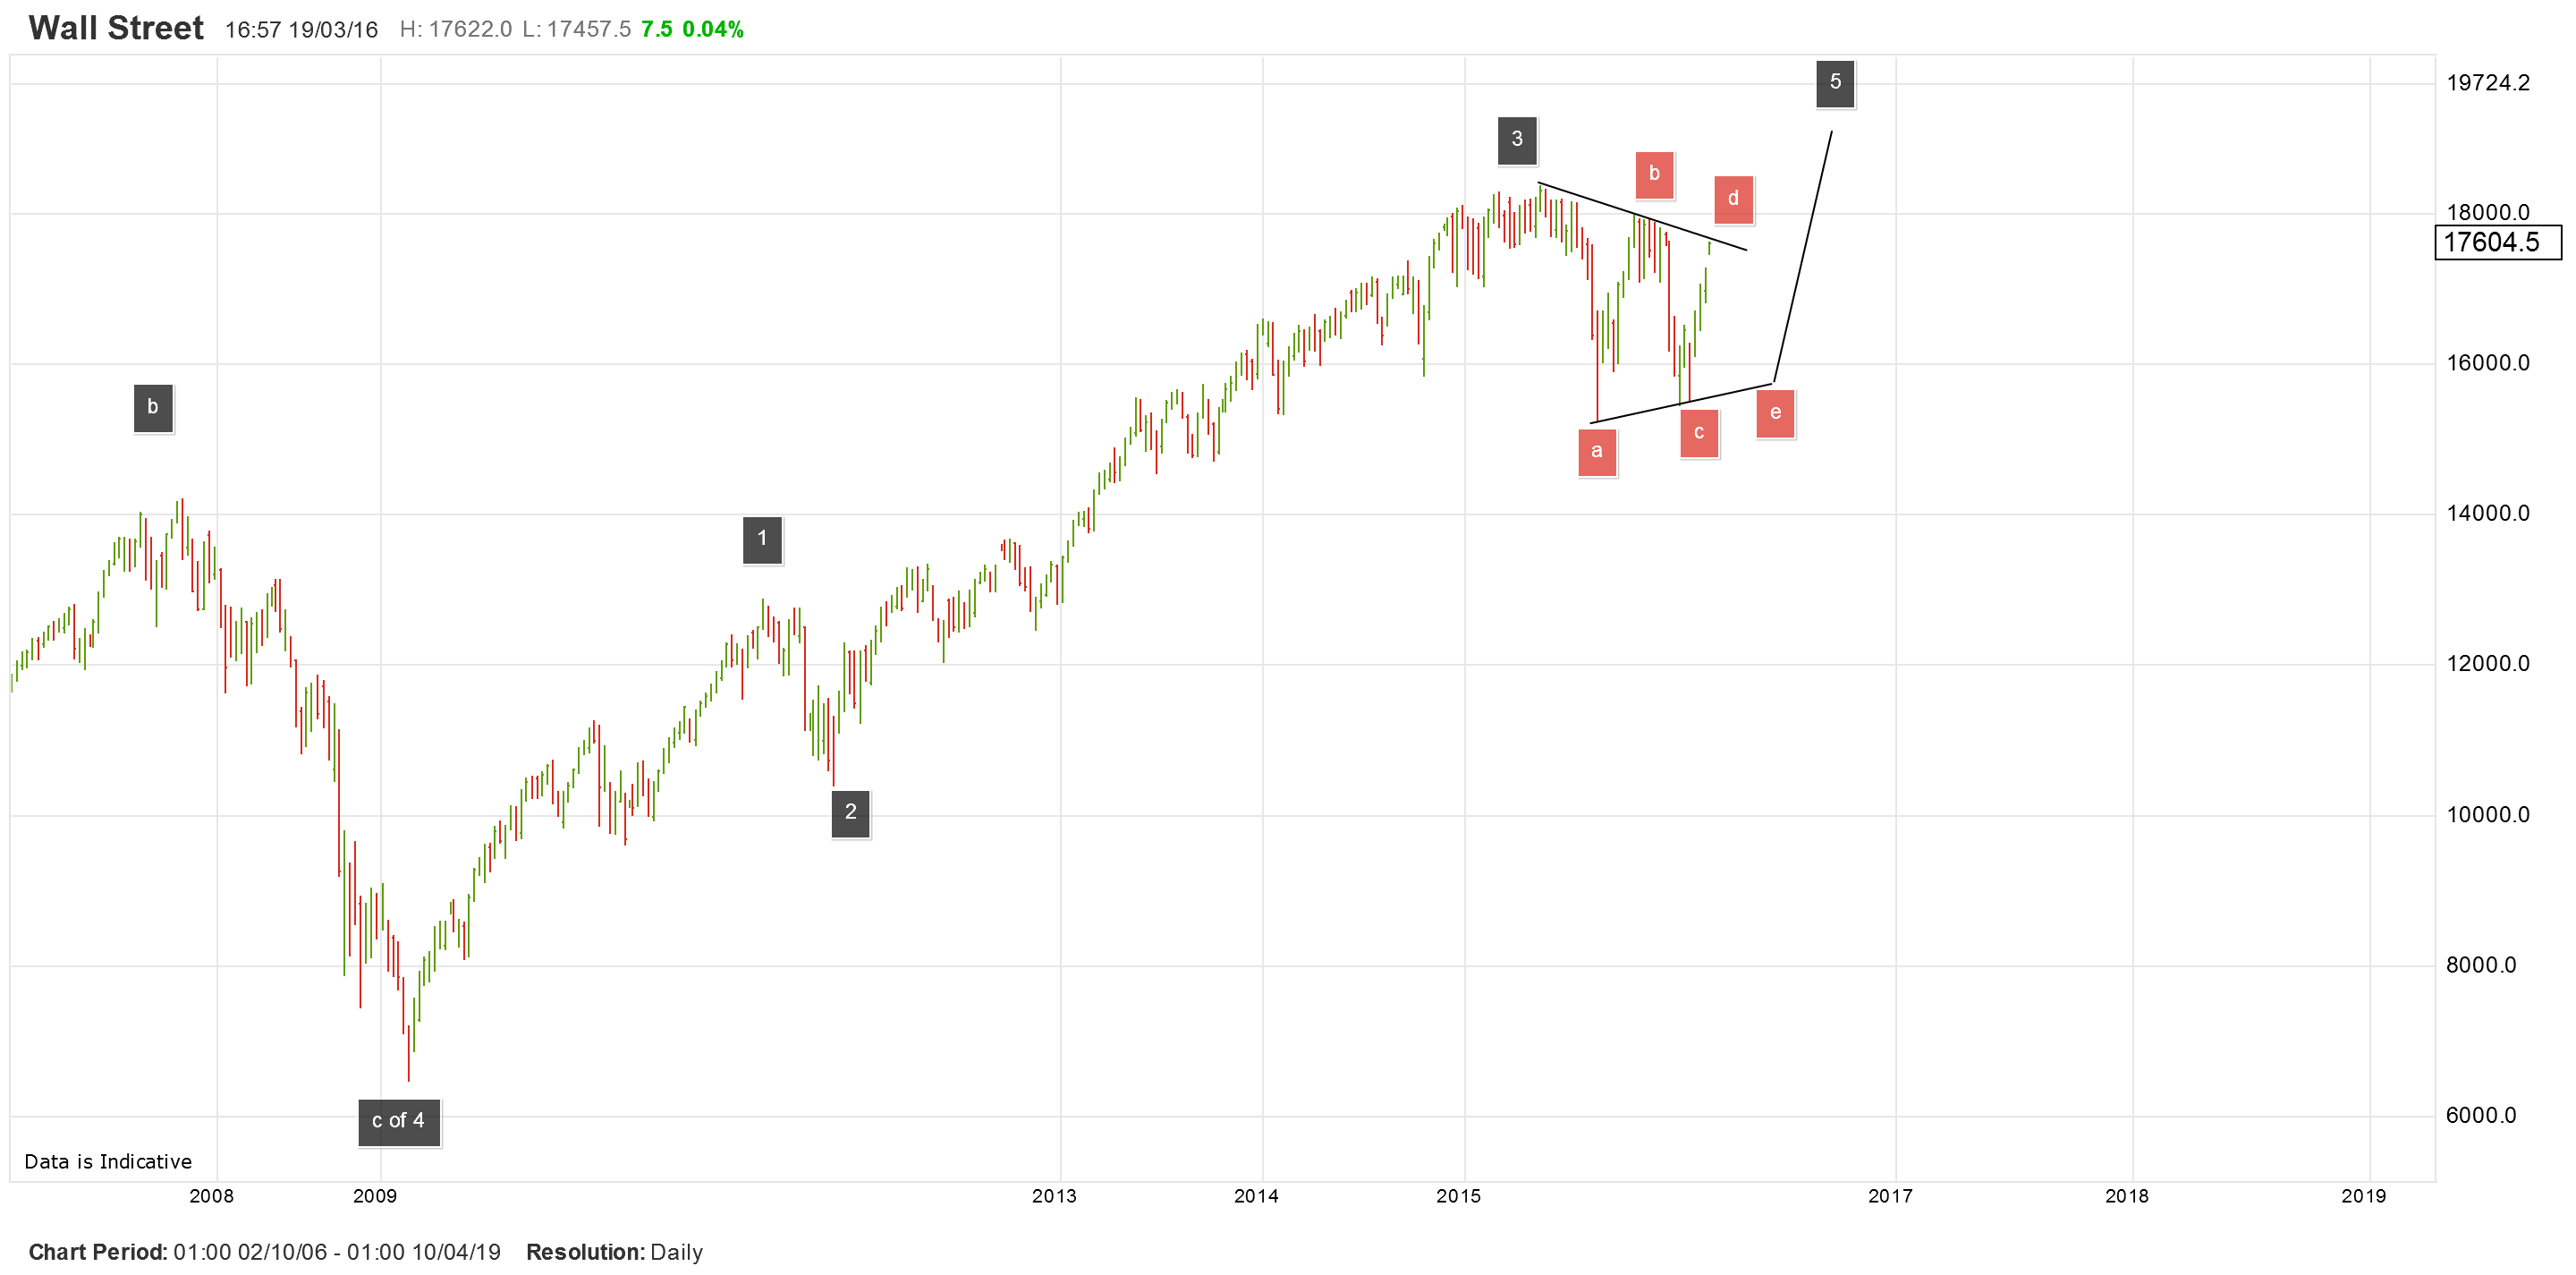
Since 2009 we have been rocketing upward in a final wave 5 thrust to all time highs.
This final wave up is tracing out 5 waves, and as you can see from the above chart 'were almost there'
Right now we seem to be in the middle of a contracting triangle, labelled in red, wave 'a' through wave 'e'.
With wave 'd' of that triangle complete as of this week we should see one last sharp move down to complete wave 'e'. this will complete wave 4 of 5.
and then a final drive higher to top out at new all time highs to complete the whole structure back to 2009.
lets keep our eyes out for that wave 'e' drop over the next few weeks, it should present a very interesting buying opportunity.
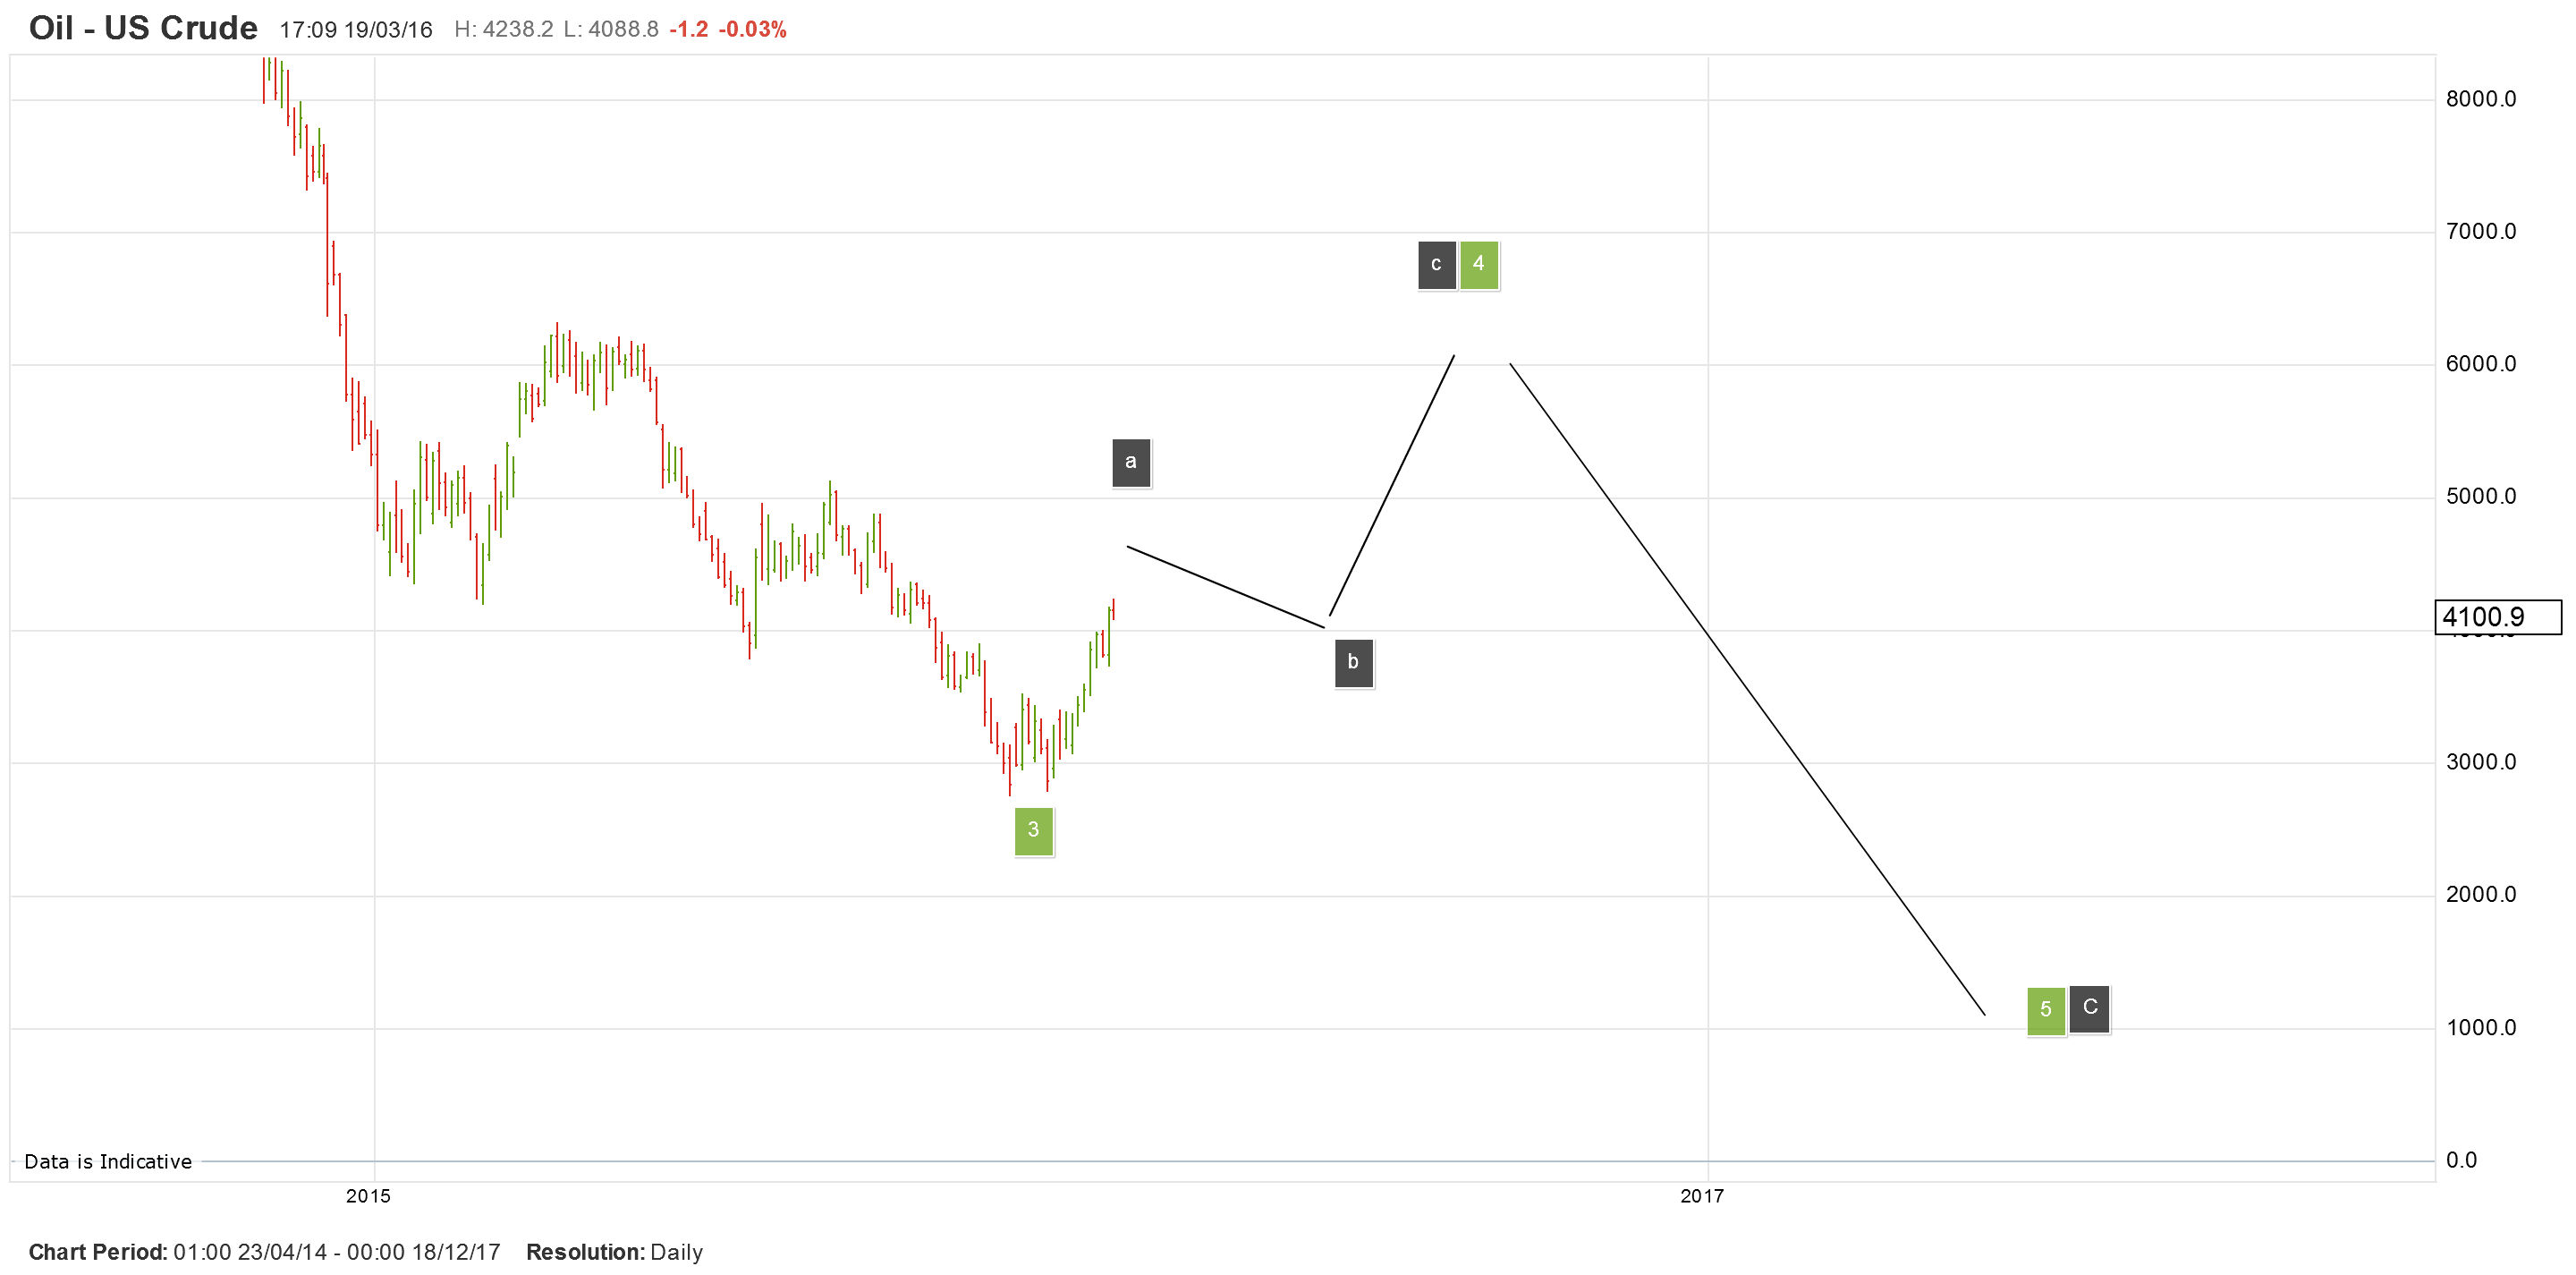
As with the Gold chart, we are again looking at a corrective move up in Crude oil.
The correction is labelled a,b,c upwards (in grey) and we seem to be near the end of that 'a' wave. A sideways correction in wave 'b' should follow and then another thrust higher in wave 'c'.
This correction higher could ultimately bring us to around the $60 handle, but I believe this will be short lived, as the larger trend still points downwards.
In fact the larger trend is pointing to a low of around $10 according to the wave model.
But I am getting ahead of myself there.
Lets look out for the current wave up to finish this week, and for a correction in wave 'b' to start then. this action might close out the month with a tradable low in place which we might look to capitalise on. until next week. happy hunting!
For more info on how to apply Elliot Wave principle in your day trading read my Elliot Wave article
Trading in Forex Exchange Market is VERY SPECULATIVE AND HIGHLY RISKY and is not suitable for all members of the general public but only for those investors who: (a) understand and are willing to assume the economic, legal and other risks involved. (b) Taking into account their personal financial circumstances, financial resources, life style and obligations are financially able to assume the loss of their entire investment. (c) Have the knowledge to understand Forex Exchange Market and the underlying assets.
Recommended Content
Editors’ Picks
EUR/USD retreats below 1.0700 after US GDP data

EUR/USD came under modest bearish pressure and retreated below 1.0700. Although the US data showed that the economy grew at a softer pace than expected in Q1, strong inflation-related details provided a boost to the USD.
GBP/USD declines below 1.2500 as USD rebounds

GBP/USD declined below 1.2500 and erased the majority of its daily gains with the immediate reaction to the US GDP report. The US economy expanded at a softer pace than expected in Q1 but the price deflator jumped to 3.4% from 1.8%.
Gold drops below $2,320 as US yields shoot higher

Gold lost its traction and turned negative on the day below $2,320 in the American session on Thursday. The benchmark 10-year US Treasury bond yield is up more than 1% on the day above 4.7% after US GDP report, weighing on XAU/USD.
XRP extends its decline, crypto experts comment on Ripple stablecoin and benefits for XRP Ledger

Ripple extends decline to $0.52 on Thursday, wipes out weekly gains. Crypto expert asks Ripple CTO how the stablecoin will benefit the XRP Ledger and native token XRP.
After the US close, it’s the Tokyo CPI

After the US close, it’s the Tokyo CPI, a reliable indicator of the national number and then the BoJ policy announcement. Tokyo CPI ex food and energy in Japan was a rise to 2.90% in March from 2.50%.
