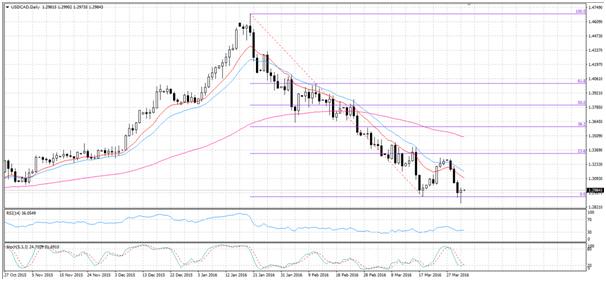
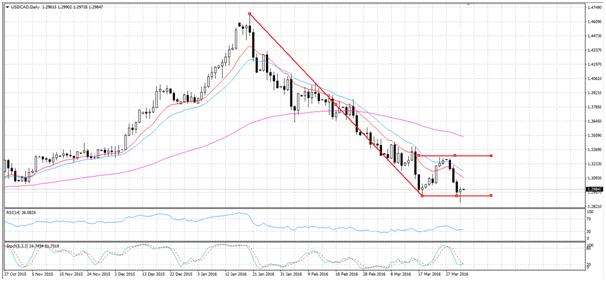
After posting continuous losses over the past few of months, the Looney may finally have some upside potential. While I don’t think anyone expects the pair to erase the epic plunge which started in January, a bearish rectangle may see the USD claim back some ground in the short term. Looking at the technicals reveals a number of compelling reasons to expect a decent rally for the pair, in spite of the spate of recent US economic indicator disappointments.
A cursory glance at the daily chart may at first appear to show the recent trend continuing within a bearish channel. Whilst there is definitely a high probability for a continuation pattern, the evidence points to wide a bearish rectangle and not a simple channel. The Fibonacci retracement demonstrates that the Looney currently ranges within two retracements levels. Specifically, the pair ranges between the 23.6% resistance and 0.0% support zones at 1.3338, and 1.2921, respectively.
Subsequently, the Looney should be moving towards the 23.6% retracement level at least once more in order to complete the rectangular pattern. The latest chart data appears to support this movement for the pair as the last two daily candles are already beginning to climb higher. Furthermore, both Stochastic and RSI oscillators are signalling the pair is oversold or close to it. Subsequently, becoming oversold generates additional buying pressure to buoy the Looney and test the 1.3338 zone of resistance once again.
In addition to the technicals, the fundamentals will assist in bringing the rectangle pattern to completion. With an expected non-farm payrolls result of 205K and a positive change to the Michigan consumer sentiment index up to 90.5, the USD should claw back some of the recent losses. On the back of the decent ADP non-farm payrolls result of 200K, it’s reasonable to expect the Bureau of Labour Statistics figures to also come in relatively favourably. Posting another solid result will go a long way in generating the requisite momentum to test the 23.6% zone of resistance. However, it is important to be aware of the divergence that occasionally occurs between the ADP and Bureau of Labour Statistics non-farm payroll results.
As a bearish rectangle is usually indicative of an eventual downside breakout, the pair cannot stay at or above the 1.3338 resistance for an extended period of time.With this chart pattern, a subsequent fall back to support is highly likely after testing resistance. As a result, keep a close eye on the pair as it draws closer to the zone of resistance to avoid being caught off guard by a reversal.
Ultimately, the Looney is likely to continue its downward slide until such a time that the US can show some real economic improvement. However, the short term may provide some respectable upside movement as the pair tests the rectangle it now finds itself in.
Forex and CFDs are leveraged financial instruments. Trading on such leveraged products carries a high level of risk and may not be suitable for all investors. Please ensure that you read and fully understand the Risk Disclosure Policy before entering any transaction with Blackwell Global Investments Limited.
Recommended Content
Editors’ Picks
AUD/USD could extend the recovery to 0.6500 and above

The enhanced risk appetite and the weakening of the Greenback enabled AUD/USD to build on the promising start to the week and trade closer to the key barrier at 0.6500 the figure ahead of key inflation figures in Australia.
EUR/USD now refocuses on the 200-day SMA

EUR/USD extended its positive momentum and rose above the 1.0700 yardstick, driven by the intense PMI-led retracement in the US Dollar as well as a prevailing risk-friendly environment in the FX universe.
Gold struggles around $2,325 despite broad US Dollar’s weakness

Gold reversed its direction and rose to the $2,320 area, erasing a large portion of its daily losses in the process. The benchmark 10-year US Treasury bond yield stays in the red below 4.6% following the weak US PMI data and supports XAU/USD.
Bitcoin price makes run for previous cycle highs as Morgan Stanley pushes BTC ETF exposure

Bitcoin (BTC) price strength continues to grow, three days after the fourth halving. Optimism continues to abound in the market as Bitcoiners envision a reclamation of previous cycle highs.
US versus the Eurozone: Inflation divergence causes monetary desynchronization

Historically there is a very close correlation between changes in US Treasury yields and German Bund yields. This is relevant at the current juncture, considering that the recent hawkish twist in the tone of the Federal Reserve might continue to push US long-term interest rates higher and put upward pressure on bond yields in the Eurozone.

