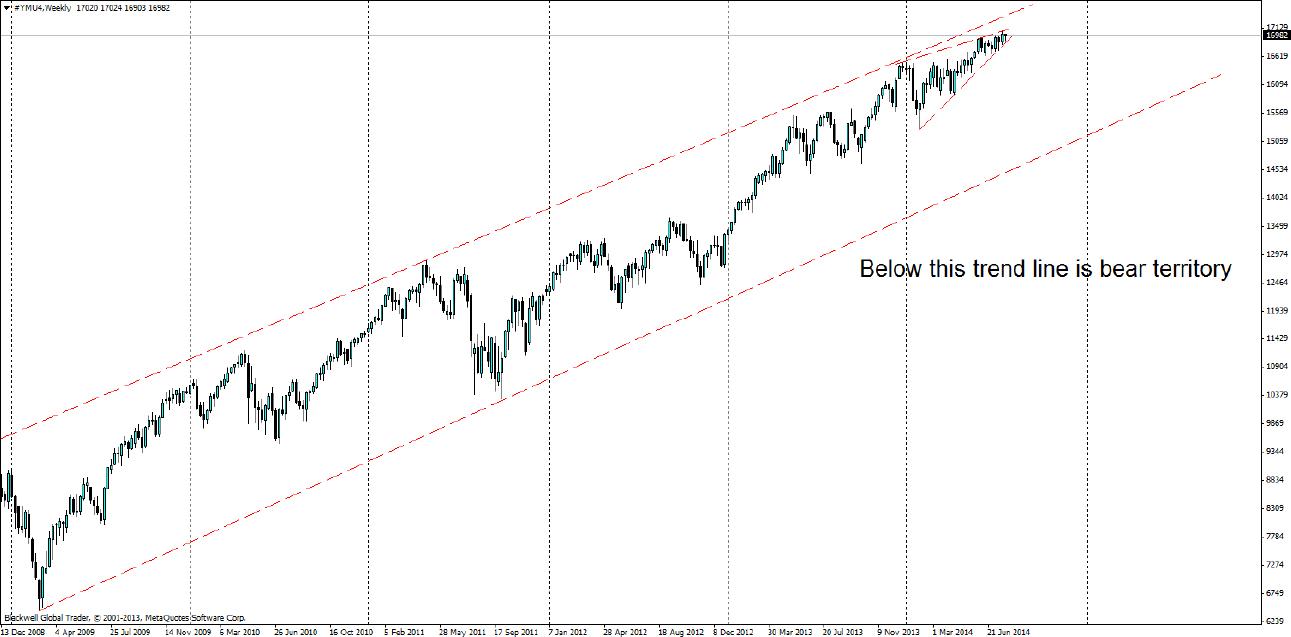
The Dow Jones has certainly been part of the bull market music procession as of late. It’s not hard to see why though either as the US economy continues to recover and as interest rates remain at record lows. On the charts we have seen a bullish run, which has extended itself on the charts since the start of 2009. So for five years we have seen a heavy upward direction in the marketplace and many are expecting/saying it will continue for some time.
The past 20 years show some interesting trends in the equity markets, especially the Dow Jones industrial average. It currently shows, markets having a correction on average every five to seven years with big dips in 1998, 2002 and 2009. It will be interesting to see if this trend has any significance in the current year, as the Dow Jones is currently looking very aggressive; in fact its growth is almost exponential on the charts in the last five years.
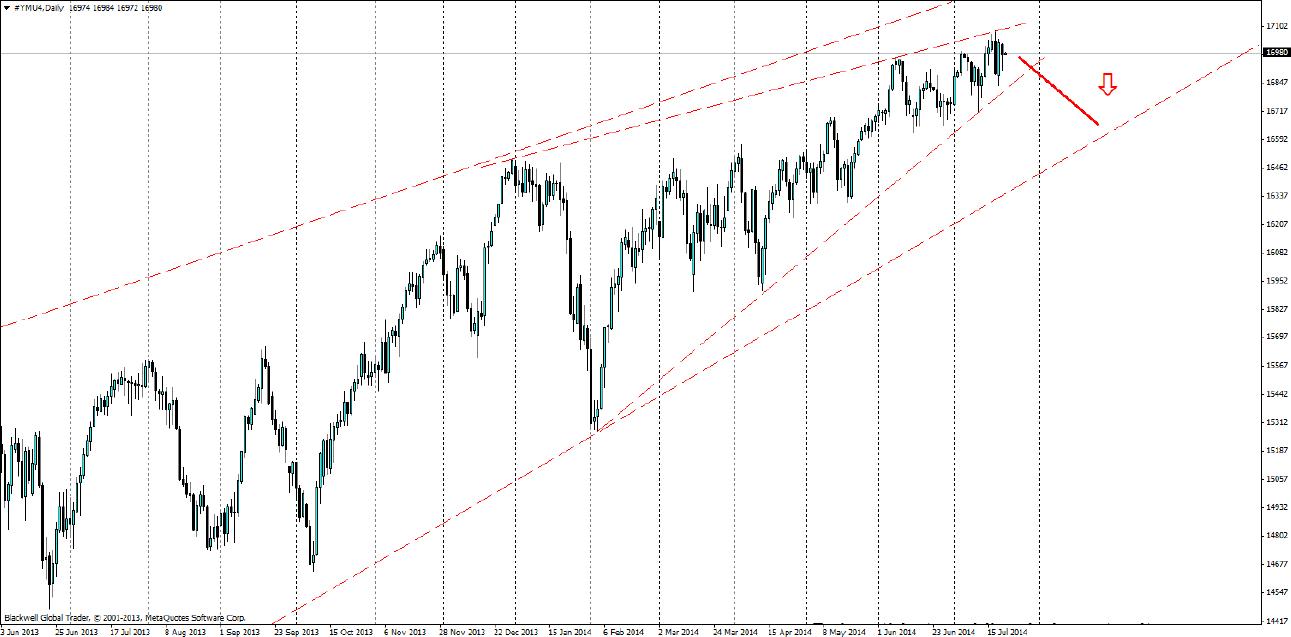
The daily chart is interesting to watch at present as an ascending wedge has formed at present. An ascending wedge is an interesting pattern on a bullish chart, as it can signal a bearish reversal or alternatively it can signal a continuation pattern on the charts.
Certainly the last few candles have been a little less certain in terms of direction, and the bulls and bears are trying to take control of the wedge. A breakthrough lower on the wedge will show the short term bearish direction for me, while a push upwards would be nothing more than a continuation pattern and further long term bullish sentiment.
In the event of a breakdown lower by the bears, it will likely aim for a trend line and 16500 levels should be considered when looking at opportunities for an exit strategy.
If you’re looking for it to continue to push lower and see a major retracement on the Dow Jones chart, you might have to wait some time.
At present there is a long way to go before the bullish trend line on the weekly chart is close to breaking down at all. Even with a major drop to the 15000 levels it’s unlikely to fire up any bears unless there was a clean breakthrough of the present trend line.
Summing it all up the wedge is one to watch as it could signal a bearish reversal. The Dow Jones on the charts is climbing aggressively high and is probably a little over extended, certainly there could be a decent short term short on the cards for the market, and traders will look to take advantage of such a movement of the present technical wedge.
Recommended Content
Editors’ Picks
EUR/USD regains traction, recovers above 1.0700

EUR/USD regained its traction and turned positive on the day above 1.0700 in the American session. The US Dollar struggles to preserve its strength after the data from the US showed that the economy grew at a softer pace than expected in Q1.
GBP/USD returns to 1.2500 area in volatile session

GBP/USD reversed its direction and recovered to 1.2500 after falling to the 1.2450 area earlier in the day. Although markets remain risk-averse, the US Dollar struggles to find demand following the disappointing GDP data.
Gold drops below $2,320 as US yields shoot higher

Gold lost its traction and turned negative on the day below $2,320 in the American session on Thursday. The benchmark 10-year US Treasury bond yield is up more than 1% on the day above 4.7% after US GDP report, weighing on XAU/USD.
XRP extends its decline, crypto experts comment on Ripple stablecoin and benefits for XRP Ledger

Ripple extends decline to $0.52 on Thursday, wipes out weekly gains. Crypto expert asks Ripple CTO how the stablecoin will benefit the XRP Ledger and native token XRP.
After the US close, it’s the Tokyo CPI

After the US close, it’s the Tokyo CPI, a reliable indicator of the national number and then the BoJ policy announcement. Tokyo CPI ex food and energy in Japan was a rise to 2.90% in March from 2.50%.


