![]()
Unless you’ve been living under a rock, you know that GBP/USD has been in freefall over the last several weeks amidst fears of a potential “Brexit” (UK exit from the European Union) come June. But in the current short-attention-span/24-hour news cycle/twitter zeitgeist, it’s easy to lose sight of the truly long-term picture.
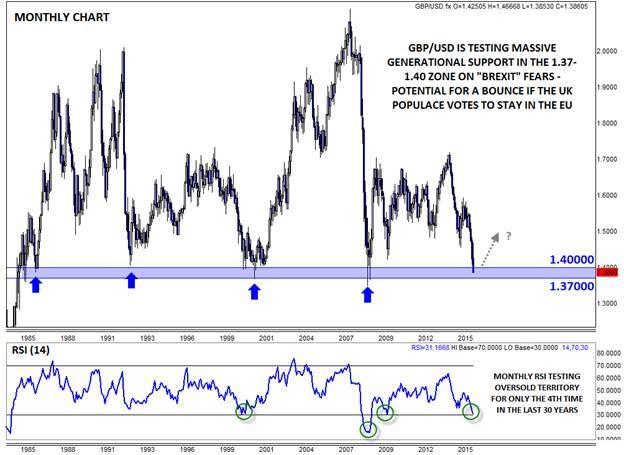
Not only has GBP/USD dropped down to test its lows from the Great Financial Crisis, but on a LONG-term perspective, the pair is actually testing a 30-year generational support level. As the below chart shows, very few traders on global trading desks have ever seen GBP/USD trade below the 1.37 handle, including even when George Soros “broke the Bank of England” back in the early 90s, the peak of the US tech boom in 2000, and the depths of the Great Financial Crisis back in 2009.
Frankly, in contrast to those dire times for cable, the outside chance of a Brexit and relatively easy monetary policy from the Bank of England seem like very manageable issues for bulls. Of course, readers should also consider the other half of the currency pair, namely the fact that the US dollar is the only developed market that is actively normalizing monetary policy, providing a long-term tailwind for buck bulls.
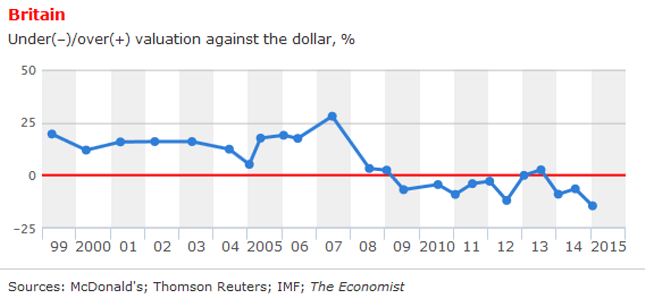
Over these extremely long-term time horizons, long-term mean reversion factors like Purchasing Power Parity (PPP), or the theory that an identical good in two different countries should cost the same amount regardless of the currency used, play a big role. As a tongue-in-cheek estimate of PPP, The Economist created the “Big Mac Index” in 1986, based on the relative cost of a Big Mac in 48 different currencies. The current Big Mac Index for PPP shows that the GBP/USD is undervalued by about 15% vs. the greenback, its lowest relative valuation this century. Over long-periods of time, we would expect this indicator to revert back toward 0% (in other words, the Big Mac Index suggests that GBP/USD may rise).

Technical View
As we noted above, there is strong previous support near the current level of GBP/USD. Specifically, the 1.37-1.40 zone has put a floor under GBP/USD on four separate occasions in the past 30 years, leading to long-term rallies between 3,500 and 7,500 pips (no typo). Of course, that’s no guarantee of a bottom forming this time around, but it does suggest that a lot of long-term traders will be keyed in on this zone. Beyond the significant support zone in price, the monthly RSI indicator is testing oversold territory (< 30) for the first time since the Great Financial Crisis and only the fourth time in the last 30 years.Over the next few weeks and months, GBP/USD will likely continue to gyrate on risk sentiment, economic data, and the latest Brexit opinion polls. But by taking a step back and putting the day-to-day moves into a long-term perspective, there’s a compelling case to be made that GBP/USD is undervalued, especially if/when the UK populace votes for the status quo to remain in the EU.

This research is for informational purposes and should not be construed as personal advice. Trading any financial market involves risk. Trading on leverage involves risk of losses greater than deposits.
Recommended Content
Editors’ Picks
AUD/USD risks a deeper drop in the short term

AUD/USD rapidly left behind Wednesday’s decent advance and resumed its downward trend on the back of the intense buying pressure in the greenback, while mixed results from the domestic labour market report failed to lend support to AUD.
EUR/USD leaves the door open to a decline to 1.0600

A decent comeback in the Greenback lured sellers back into the market, motivating EUR/USD to give away the earlier advance to weekly tops around 1.0690 and shift its attention to a potential revisit of the 1.0600 neighbourhood instead.
Gold is closely monitoring geopolitics

Gold trades in positive territory above $2,380 on Thursday. Although the benchmark 10-year US Treasury bond yield holds steady following upbeat US data, XAU/USD continues to stretch higher on growing fears over a deepening conflict in the Middle East.
Bitcoin price shows strength as IMF attests to spread and intensity of BTC transactions ahead of halving

Bitcoin (BTC) price is borderline strong and weak with the brunt of the weakness being felt by altcoins. Regarding strength, it continues to close above the $60,000 threshold for seven weeks in a row.
Is the Biden administration trying to destroy the Dollar?

Confidence in Western financial markets has already been shaken enough by the 20% devaluation of the dollar over the last few years. But now the European Commission wants to hand Ukraine $300 billion seized from Russia.