![]()
The recent stabilisation of the stock markets has raised hopes that we may have seen a near-term bottom for equities. This view has mainly been supported by central banks’ desire to hold down interest rates at or below zero, while up until today, oil prices looked like they had also formed a base. Today however, question marks have been raised once more after some of the world’s large oil exporting countries merely made a contingent agreement to “freeze” (rather than cut) oil production at near record levels. This caused oil prices to fall on disappointment they failed to agree on a production cut. Meanwhile economic data has deteriorated further. At the start of this week, we have already learned about a 0.4% contraction in the Japanese economy in the fourth quarter of last year, which was worse than expected, while the latest Chinese trade figures also showed sharp drops in both exports and imports. Still, the markets have held their own relatively well today.
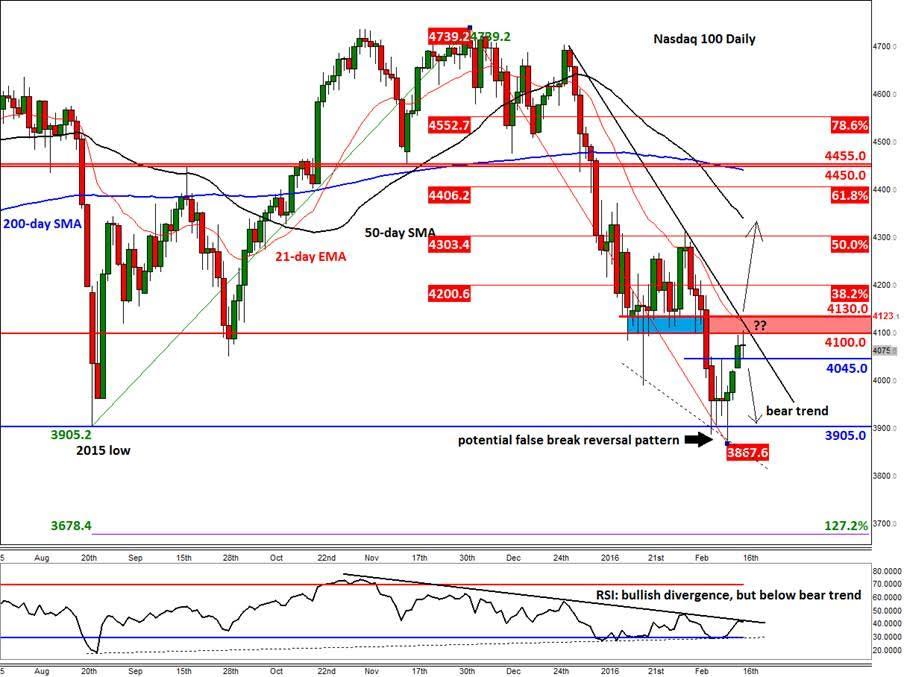
While no one can say for certain where stocks are headed, most people will agree that they are not out of the woods just yet. Indeed, many still believe this is just the start of a more severe correction. In the short-term, price action is our best guide. On that front, the chart of the Nasdaq 100 could provide a strong indication about the market’s next move, for at the moment it is trading in no man’s land, between a rock and hard places.As can be seen from the daily chart, below, the Nasdaq 100 has reached a key technical resistance area between 4100-4130. This area was previously support, while a bearish trend line also meets the 21-day exponential moving average here. The conflux of all these technical indications suggests that at the very least we may see a small pullback from here. In fact, this move was already underway when this report was being written. What happens next will depend on price action around the previous resistance at 4045. There is a possibility that this level could now turn into support, leading to further gains. But should the index break below here then there is little further support seen until 3905, which was the low from 2015 and briefly breached on a couple of occasions already this month.
But with the Nasdaq managing to hold its own above the 3905 level on a daily closing basis, there is a possibility we may have seen a false breakdown reversal pattern unfold there. This view is supported by the positively diverging RSI, which points to weakening of the selling pressure. But as the trend is still bearish, with the moving averages in the “wrong” order and the downward-sloping trend still intact, it is important not to read too much into it. The way I would interpret this situation is “guilty until proven innocent.” For that reason, bullish traders should remain nimble and wait for further confirmation.
If the Nasdaq breaks above the highlighted region of 4100-4130 then there is an increased likelihood that we may see a more profound recovery. Conversely, if support at 4045 breaks then the short term outlook would flip back to bearish. And if the 3905 level finally gives way on a closing basis then all bets are off. In this potential scenario, the next stop could be at the 127.2% Fibonacci extension of the previous upswing, around 3680.

Trading leveraged products such as FX, CFDs and Spread Bets carry a high level of risk which means you could lose your capital and is therefore not suitable for all investors. All of this website’s contents and information provided by Fawad Razaqzada elsewhere, such as on telegram and other social channels, including news, opinions, market analyses, trade ideas, trade signals or other information are solely provided as general market commentary and do not constitute a recommendation or investment advice. Please ensure you fully understand the risks involved by reading our disclaimer, terms and policies.
Recommended Content
Editors’ Picks
USD/JPY holds near 155.50 after Tokyo CPI inflation eases more than expected

USD/JPY is trading tightly just below the 156.00 handle, hugging multi-year highs as the Yen continues to deflate. The pair is trading into 30-plus year highs, and bullish momentum is targeting all-time record bids beyond 160.00, a price level the pair hasn’t reached since 1990.
AUD/USD stands firm above 0.6500 with markets bracing for Aussie PPI, US inflation

The Aussie Dollar begins Friday’s Asian session on the right foot against the Greenback after posting gains of 0.33% on Thursday. The AUD/USD advance was sponsored by a United States report showing the economy is growing below estimates while inflation picked up.
Gold soars as US economic woes and inflation fears grip investors

Gold prices advanced modestly during Thursday’s North American session, gaining more than 0.5% following the release of crucial economic data from the United States. GDP figures for the first quarter of 2024 missed estimates, increasing speculation that the US Fed could lower borrowing costs.
Ethereum could remain inside key range as Consensys sues SEC over ETH security status

Ethereum appears to have returned to its consolidating move on Thursday, canceling rally expectations. This comes after Consensys filed a lawsuit against the US SEC and insider sources informing Reuters of the unlikelihood of a spot ETH ETF approval in May.
Bank of Japan expected to keep interest rates on hold after landmark hike

The Bank of Japan is set to leave its short-term rate target unchanged in the range between 0% and 0.1% on Friday, following the conclusion of its two-day monetary policy review meeting for April. The BoJ will announce its decision on Friday at around 3:00 GMT.