European stock markets opened sharply lower this morning, before staging a recovery by mid-morning. Sentiment was once again hit by the falling price of oil, which dipped back below the pivotal $30 handle, and concerns over China, where equities dropped by another huge 6 per cent overnight. Investors are clearly worried about the prospects of a sharp slowdown at the world’s second largest economy and the corresponding capital outflows there. The lack of a significant follow-through in bullish momentum has also raised concerns that last week’s rally may have been just an oversold bounce. Likewise, crude’s inability to add to the gains from last week suggests that bullish investors didn’t really believe they had seen a bottom.
That being said, both stocks and crude oil prices formed large reversal-looking technical patterns on their charts last week, so undoubtedly some of the existing shorts may have used this morning sell-off as an opportunity to exit more of their positions, while those who had missed out on the rally, may have decided to step in after the latest retracement. This may help to explain why both crude and stocks climbed off their worst levels in mid-morning as no fresh news was released then. In fact, the economic calendar is looking rather empty today, so technical buying and selling could dominate the agenda for now, possibly until Apple releases its earnings results after the closing bell on Wall Street.
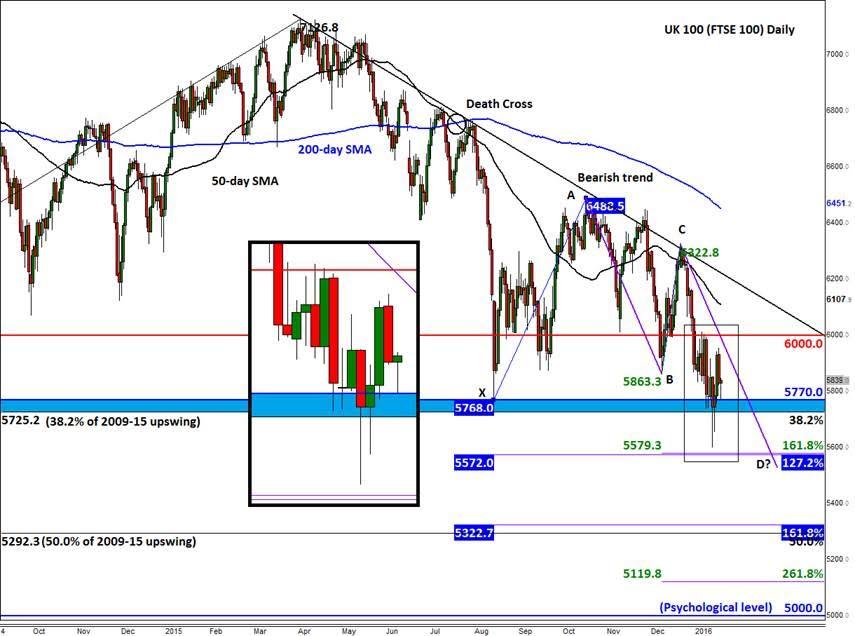
At the height of the sell-off last week, the FTSE fell for a time below its 2015 at 5765/70 as well as its long-term 38.2% Fibonacci retracement level of the entire upswing from 2009, at 5725. The selling pressure eventually ended at 5600, just ahead of the Fibonacci-based targets around point D of an ABCD move as shown on the chart. The FTSE then managed to climb back above its 2015 low in the second half of last week. As a result, the index was able to climb all the way back to around 5950 as the sellers rushed for the exits before the kick-back rally lost momentum. This morning saw the index again go for a test of the 2015 low (of 5765/70), before bouncing back. Clearly this is a very important level for traders and what happens here could provide a good clue about what to expect in the next several trading days.
If the buyers continue to hold their ground around the 2015 low of 5765/70 then there is a possibility for a rally towards, if not beyond, 6000, and potentially all the way back to the 50-day moving average at 6105 or the bearish trend line around 6200 over time. Conversely, if the 2015 low breaks down once more, then this would clear the way for the above-mentioned projected point D of an ABCD price pattern around 5570/80. Here, the 127.2% Fibonacci extension level of the bounce from August meets the 161.8% extension level of another swing (i.e. the BC move). But if we were to get to this target, I wouldn’t be surprised to see the FTSE eventually go even lower, say, towards the 5290-5325 area next. This is where the long-term 50% retracement level convergences with the 161.8% extension of the bounce from August (i.e. XA swing).
-------
Who were the best experts in 2015? Have your say and vote for FXStreet's Forex Best Awards 2016! Cast your vote now!
-------
Trading leveraged products such as FX, CFDs and Spread Bets carry a high level of risk which means you could lose your capital and is therefore not suitable for all investors. All of this website’s contents and information provided by Fawad Razaqzada elsewhere, such as on telegram and other social channels, including news, opinions, market analyses, trade ideas, trade signals or other information are solely provided as general market commentary and do not constitute a recommendation or investment advice. Please ensure you fully understand the risks involved by reading our disclaimer, terms and policies.
Recommended Content
Editors’ Picks
EUR/USD clings to daily gains above 1.0650

EUR/USD gained traction and turned positive on the day above 1.0650. The improvement seen in risk mood following the earlier flight to safety weighs on the US Dollar ahead of the weekend and helps the pair push higher.
GBP/USD recovers toward 1.2450 after UK Retail Sales data

GBP/USD reversed its direction and advanced to the 1.2450 area after touching a fresh multi-month low below 1.2400 in the Asian session. The positive shift seen in risk mood on easing fears over a deepening Iran-Israel conflict supports the pair.
Gold holds steady at around $2,380 following earlier spike

Gold stabilized near $2,380 after spiking above $2,400 with the immediate reaction to reports of Israel striking Iran. Meanwhile, the pullback seen in the US Treasury bond yields helps XAU/USD hold its ground.
Bitcoin Weekly Forecast: BTC post-halving rally could be partially priced in Premium

Bitcoin price shows no signs of directional bias while it holds above $60,000. The fourth BTC halving is partially priced in, according to Deutsche Bank’s research.
Geopolitics once again take centre stage, as UK Retail Sales wither

Nearly a week to the day when Iran sent drones and missiles into Israel, Israel has retaliated and sent a missile into Iran. The initial reports caused a large uptick in the oil price.
