![]()
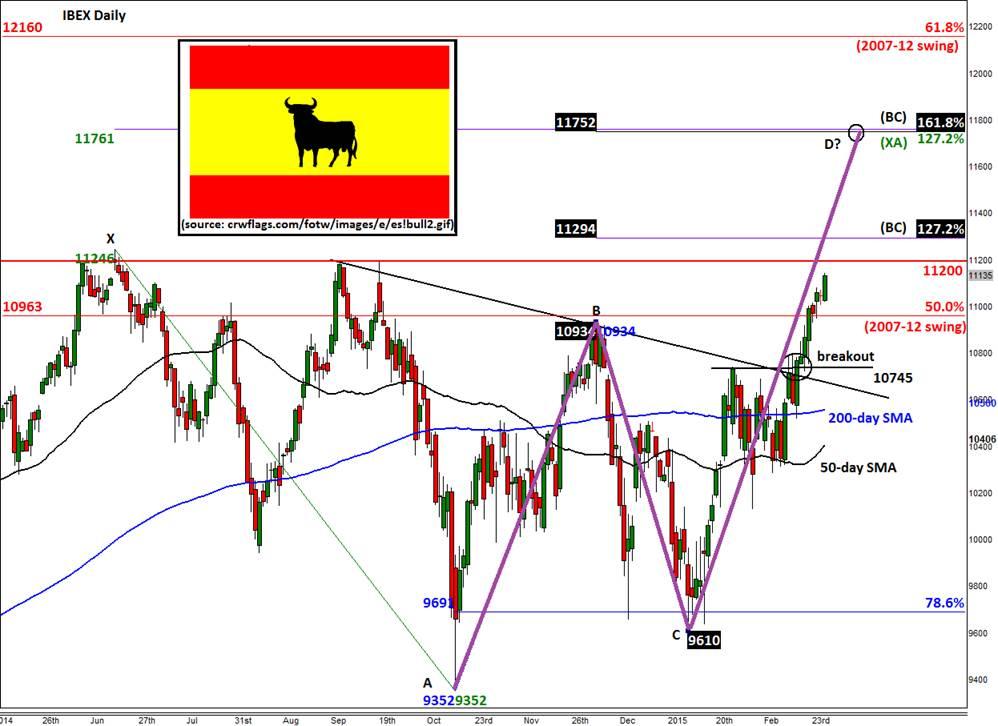
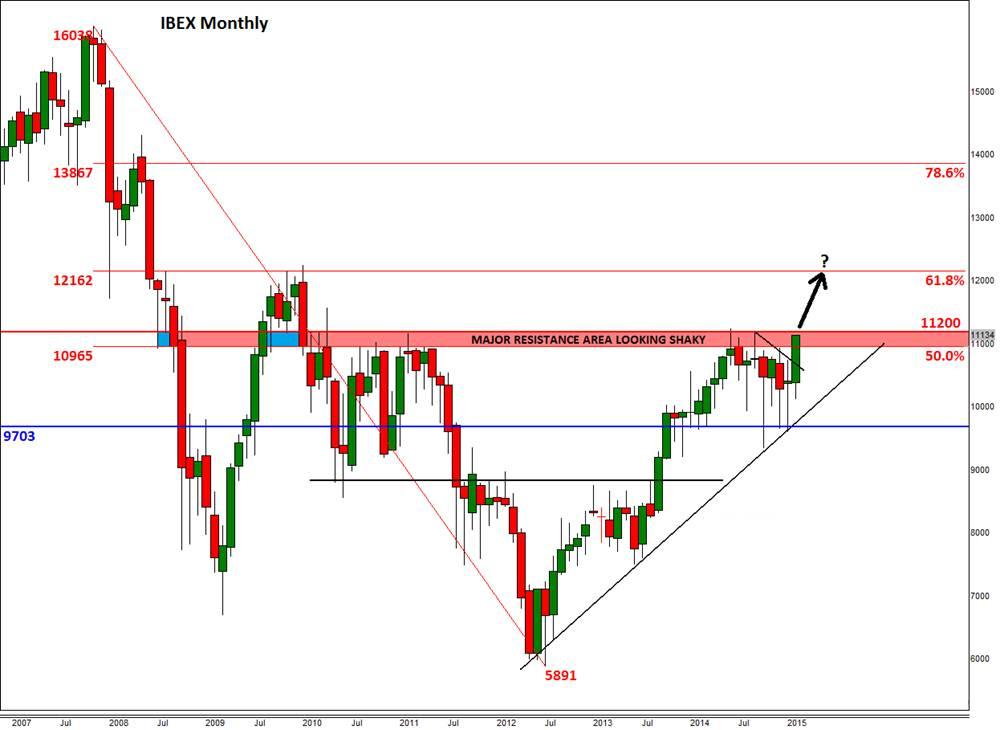
As we have already published some bullish reports on the FTSE, CAC, DAX and Euro Stoxx recently, today we are looking at the IBEX index. Below we have two charts of the Spanish benchmark index, both displaying clear bullish patterns. The monthly chart shows that the IBEX has been in an upward trend since bottoming out in 2012. In recent months, the index has consolidated in a relatively tight range below the 11200 handle, suggesting that it may be gearing up for a potential breakout towards the long-term 61.8% Fibonacci retracement level of the downswing from the 2007 crash, around 12160. On the daily chart, one can see that it has recently broken above its main moving averages and also a bearish trend line. The breakout was confirmed once the prior high around 10745 was cleared (area circled on the chart). It has since been moving higher and is now not too far off that 11200 handle. A decisive break through this level could target 11750/60. This is where the 127.2 and 161.8 per cent Fibonacci extension levels of the last two downswings converge. From there, it may pullback a little bit on profit-taking before potentially pushing higher again towards that long-term 61.8% Fibonacci level (see the monthly chart). Meanwhile a potentially bearish scenario would be if the index fails to crack this 11200 yet again. But the bulls will only be concerned if the index also goes on to break support at 10930. If it does, then it may push back towards 10745 before deciding on its next move.


Information on these pages contains forward-looking statements that involve risks and uncertainties. Markets and instruments profiled on this page are for informational purposes only and should not in any way come across as a recommendation to buy or sell in these assets. You should do your own thorough research before making any investment decisions. FXStreet does not in any way guarantee that this information is free from mistakes, errors, or material misstatements. It also does not guarantee that this information is of a timely nature. Investing in Open Markets involves a great deal of risk, including the loss of all or a portion of your investment, as well as emotional distress. All risks, losses and costs associated with investing, including total loss of principal, are your responsibility. The views and opinions expressed in this article are those of the authors and do not necessarily reflect the official policy or position of FXStreet nor its advertisers. The author will not be held responsible for information that is found at the end of links posted on this page.
If not otherwise explicitly mentioned in the body of the article, at the time of writing, the author has no position in any stock mentioned in this article and no business relationship with any company mentioned. The author has not received compensation for writing this article, other than from FXStreet.
FXStreet and the author do not provide personalized recommendations. The author makes no representations as to the accuracy, completeness, or suitability of this information. FXStreet and the author will not be liable for any errors, omissions or any losses, injuries or damages arising from this information and its display or use. Errors and omissions excepted.
The author and FXStreet are not registered investment advisors and nothing in this article is intended to be investment advice.
Recommended Content
Editors’ Picks
EUR/USD clings to gains near 1.0700, awaits key US data

EUR/USD clings to gains near the 1.0700 level in early Europe on Thursday. Renewed US Dollar weakness offsets the risk-off market environment, supporting the pair ahead of the key US GDP and PCE inflation data.
USD/JPY keeps pushing higher, eyes 156.00 ahead of US GDP data

USD/JPY keeps breaking into its highest chart territory since June of 1990 early Thursday, recapturing 155.50 for the first time in 34 years as the Japanese Yen remains vulnerable, despite looming intervention risks. The focus shifts to Thursday's US GDP report and the BoJ decision on Friday.
Gold closes below key $2,318 support, US GDP holds the key

Gold price is breathing a sigh of relief early Thursday after testing offers near $2,315 once again. Broad risk-aversion seems to be helping Gold find a floor, as traders refrain from placing any fresh directional bets on the bright metal ahead of the preliminary reading of the US first-quarter GDP due later on Thursday.
Injective price weakness persists despite over 5.9 million INJ tokens burned

Injective price is trading with a bearish bias, stuck in the lower section of the market range. The bearish outlook abounds despite the network's deflationary efforts to pump the price.
Meta takes a guidance slide amidst the battle between yields and earnings

Meta's disappointing outlook cast doubt on whether the market's enthusiasm for artificial intelligence. Investors now brace for significant macroeconomic challenges ahead, particularly with the release of first-quarter GDP data.