![]()
Although commodity prices are somewhat firmer today, the same cannot be said about the stocks of the companies that produce them. Miners are once again dominating the bottom half of the FTSE 100 index, with Anglo American sliding another 8 per cent to a fresh low. We covered the FTSE in detail yesterday HERE. The wider European markets are likewise in the red, although off their lows, so who knows we could have a rare green day by the close of play today. Generally speaking however, risk is still off the menu after last week’s disappointment from the ECB and renewed concerns about China. The world’s second largest economy, which is also the largest buyer of metals and significant purchaser of other commodities, reported a big 6.8% and the fifth consecutive drop in exports and 8.7% decline in imports on Tuesday. However the latest inflation data that was released overnight shows consumer prices actually rose 1.5% year-over-year in November. In addition, the Japanese GDP was revised favourably on Tuesday to show a 0.3% growth in the third quarter rather than a 0.2% contraction. What’s more, the Munich-based economic institute Ifo has lifted its 2016 growth forecast for Germany to 1.9% from 1.8% previously. Meanwhile oil and metal prices are showing signs of stabilization at these depressed levels, so commodity stocks could bounce back and help support the indices. And more importantly, the Federal Reserve may decide to send out a particularly dovish message to the markets next week, so it is not all doom and gloom… yet.
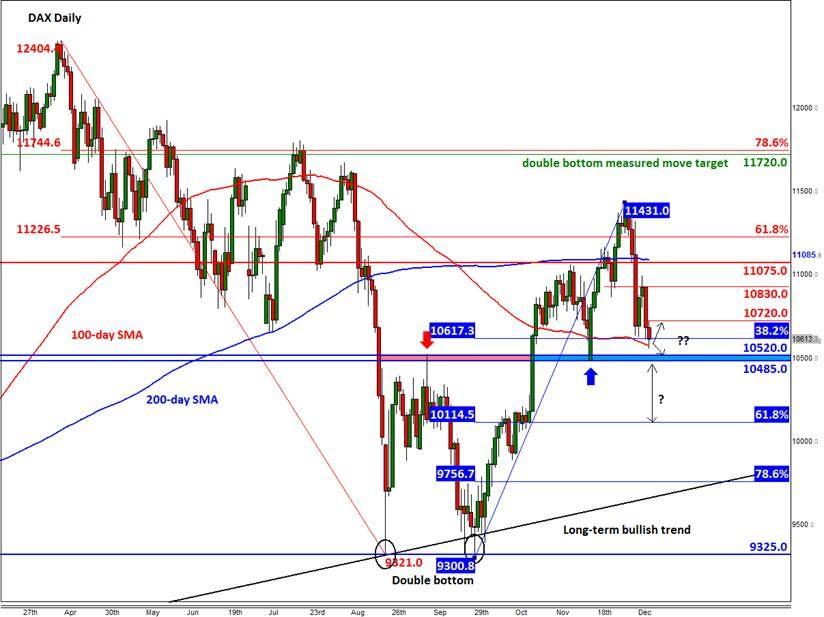
From a technical point of view, the German DAX index is approaching some very important levels. This means that we will either see a nice bounce or a nasty acceleration in the downtrend, depending on what happens here.
The daily chart shows that the long-term trend is still bullish for the DAX, but the recent drop below the 200-day average is not so bullish at all. Several key short term supports have broken down, too. However, the index is still holding its own above the major pivotal area between 10485 and 10520. Previously, this area was support and resistance. Today and at the time of this writing, it was testing the 38.2% Fibonacci retracement level (10615) of the most recent upswing from the double bottom low (9300/25) that was created at the end of September. Here, it was also testing the 100-day average at 10570. So, it could easily bounce back from here or any of these support levels just mentioned. If realised, the bulls will then want to see the breakdown of some resistance levels, starting with today’s high at 10720. Further resistance levels come in at 10830 and then 11075.
However, if more supports break down then the sellers will grow further in confidence. As mentioned, the pivotal area is between 10485 and 10520. Should this key support region give way then there is little further support until the 61.8% Fibonacci level at 10115, or even the long-term bullish trend which comes in around the 78.6% retracement level (9755). So, there is the potential for a BIG drop.
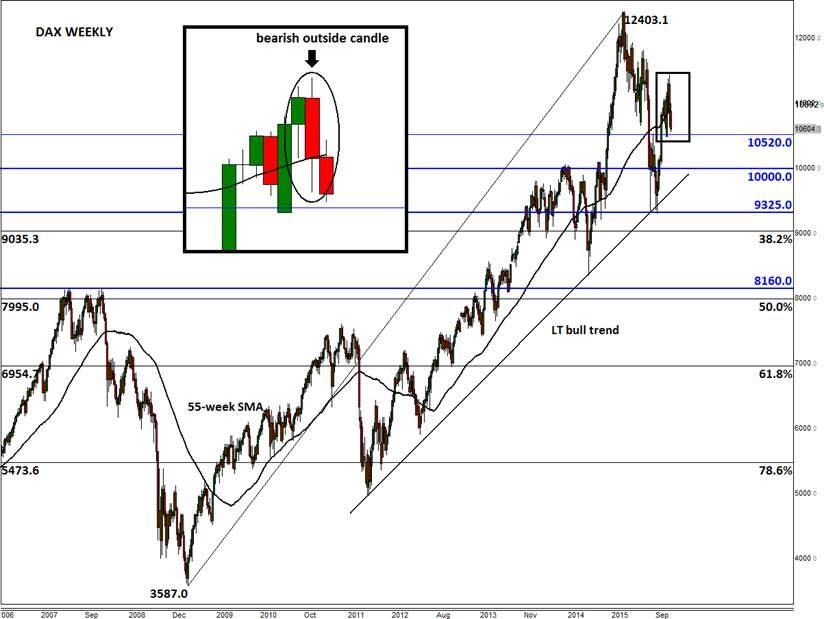
Turning our attention to the more important weekly time frame and it is the bearish engulfing/outside candle of last week that is catching our attention, with the index also moving below its 55-week moving average. On this time frame, the 10520 support is also noticeable, but should this level break down then there is not much further support until the long-term bullish trend which comes in below the psychologically-important 10000 mark.
Trading leveraged products such as FX, CFDs and Spread Bets carry a high level of risk which means you could lose your capital and is therefore not suitable for all investors. All of this website’s contents and information provided by Fawad Razaqzada elsewhere, such as on telegram and other social channels, including news, opinions, market analyses, trade ideas, trade signals or other information are solely provided as general market commentary and do not constitute a recommendation or investment advice. Please ensure you fully understand the risks involved by reading our disclaimer, terms and policies.
Recommended Content
Editors’ Picks
EUR/USD clings to daily gains above 1.0650

EUR/USD gained traction and turned positive on the day above 1.0650. The improvement seen in risk mood following the earlier flight to safety weighs on the US Dollar ahead of the weekend and helps the pair push higher.
GBP/USD recovers toward 1.2450 after UK Retail Sales data

GBP/USD reversed its direction and advanced to the 1.2450 area after touching a fresh multi-month low below 1.2400 in the Asian session. The positive shift seen in risk mood on easing fears over a deepening Iran-Israel conflict supports the pair.
Gold holds steady at around $2,380 following earlier spike

Gold stabilized near $2,380 after spiking above $2,400 with the immediate reaction to reports of Israel striking Iran. Meanwhile, the pullback seen in the US Treasury bond yields helps XAU/USD hold its ground.
Bitcoin Weekly Forecast: BTC post-halving rally could be partially priced in Premium

Bitcoin price shows no signs of directional bias while it holds above $60,000. The fourth BTC halving is partially priced in, according to Deutsche Bank’s research.
Week ahead – US GDP and BoJ decision on top of next week’s agenda

US GDP, core PCE and PMIs the next tests for the Dollar. Investors await BoJ for guidance about next rate hike. EU and UK PMIs, as well as Australian CPIs also on tap.

