![]()
More than ever the OPEC needed a clear strategy to help shore up oil prices on Friday. But failing to even agree on an oil production ceiling, not only does this mean that the global supply glut will remain in place for a lot longer than expected, but it also brings into question the organization’s role as a cartel. Oil producing nations and companies will therefore continue to do what is in their own best interest and produce as much oil as possible in order to stay in the game and avoid losing market share. Eventually, some of the weaker producers will go out of business. This, combined with industry consolidation and stronger demand, means we are getting closer to a bottom for oil prices. But this could take at least several months as shale producers are still surprisingly resilient. In the short-term, the excessive surplus will continue to exert heavy pressure on prices, which should help to keep the potential gains in check.
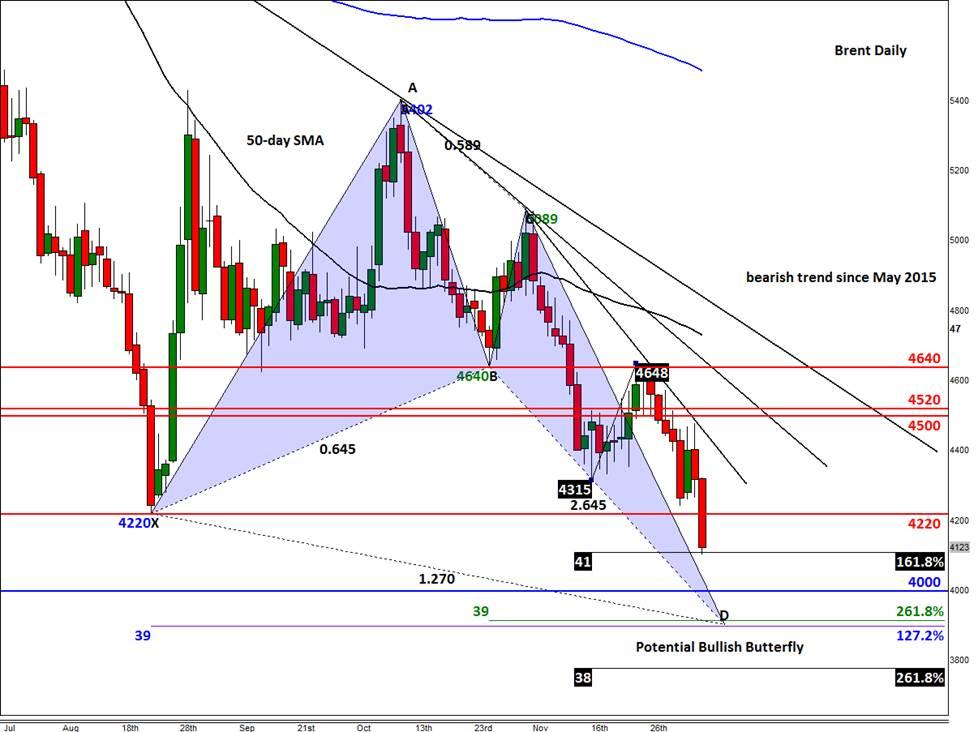
At the time of this writing, Brent oil was finding itself at just shy of $41 a barrel, a fresh multi-year low. Here, it was testing the 161.8% Fibonacci extension level of its most recent upswing. Thus, we may see some profit-taking around this exhaustion point, which could lead to a bounce of some sort. If Brent does find support here, or at another level lower, it could eventually rise to test the broken support – now resistance – at $42.20. Failure to bounce $41 however would expose the psychologically-important $40 handle for a test. If this level also breaks down, Brent may then drop to the Fibonacci converges area around $39.00 before potentially bouncing from there as the shorts take profit. The $39.00 level is also the extended point D of an AB=CD move, so it represents a Bullish Butterfly pattern, which can sometimes pin-point the exact top, and in this case, bottom. A potentially bullish outcome for Brent would be if it rallies from these levels and end today’s session back above $42.20 and thereby create a false breakdown signal. If this admittedly unlikely scenario happens, we may then see a significant bounce in the following days, particularly because of the extreme negative sentiment at the moment.
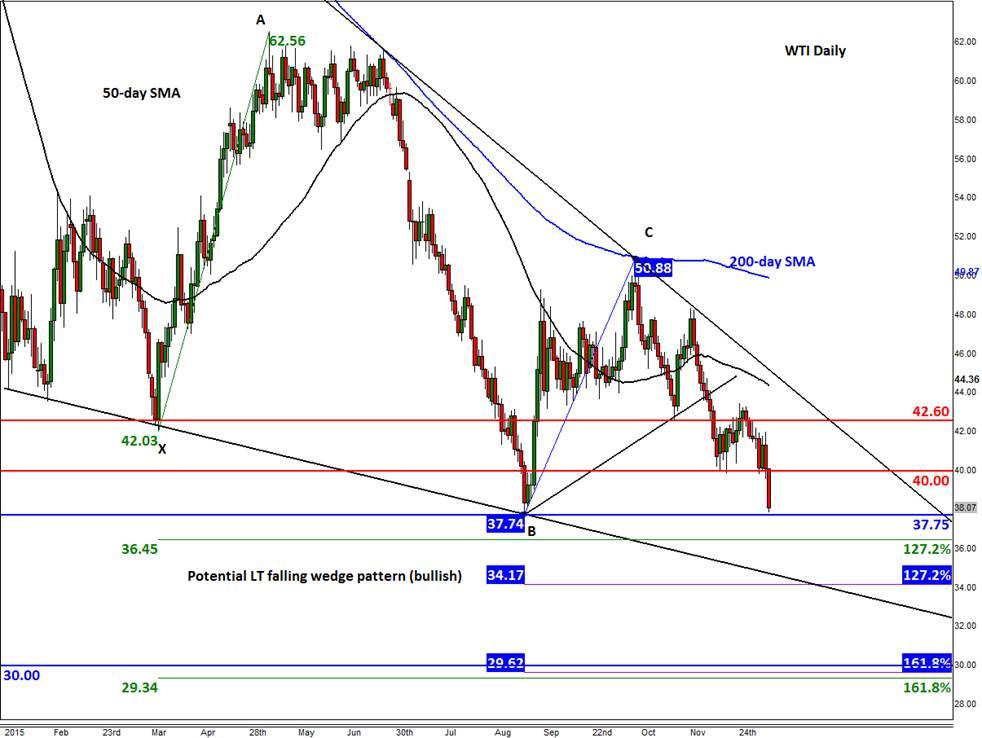
WTI meanwhile could follow Brent and break its earlier 2015 low of around $37.75 today or in the coming days. At the time of this writing, the US oil contract was just 25 cents away from this level, so it wasn’t looking great for the bulls. The Fibonacci extension levels from the previous price swings are shown on the chart, in figure 2. These would be among the possible support levels to watch. In addition, there is a potential falling wedge pattern in the making; the support trend of this formation needs to be watched closely around $34 a barrel. The key resistance for WTI is the old support at $40. The near-term bias remains bearish while it holds below here on a closing basis.
Figure 1:
Figure 2:
Trading leveraged products such as FX, CFDs and Spread Bets carry a high level of risk which means you could lose your capital and is therefore not suitable for all investors. All of this website’s contents and information provided by Fawad Razaqzada elsewhere, such as on telegram and other social channels, including news, opinions, market analyses, trade ideas, trade signals or other information are solely provided as general market commentary and do not constitute a recommendation or investment advice. Please ensure you fully understand the risks involved by reading our disclaimer, terms and policies.
Recommended Content
Editors’ Picks
EUR/USD consolidates gains below 1.0700 amid upbeat mood

EUR/USD is consolidating its recovery below 1.0700 in the European session on Thursday. The US Dollar holds its corrective decline amid improving market mood, despite looming Middle East geopolitical risks. Speeches from ECB and Fed officials remain on tap.
GBP/USD clings to moderate gains above 1.2450 on US Dollar weakness

GBP/USD is clinging to recovery gains above 1.2450 in European trading on Thursday. The pair stays supported by a sustained US Dollar weakness alongside the US Treasury bond yields. Risk appetite also underpins the higher-yielding currency pair. ahead of mid-tier US data and Fedspeak.
Gold appears a ‘buy-the-dips’ trade on simmering Israel-Iran tensions

Gold price attempts another run to reclaim $2,400 amid looming geopolitical risks. US Dollar pulls back with Treasury yields despite hawkish Fedspeak, as risk appetite returns.
Ripple faces significant correction as former SEC litigator says lawsuit could make it to Supreme Court

Ripple (XRP) price hovers below the key $0.50 level on Thursday after failing at another attempt to break and close above the resistance for the fourth day in a row.
Have we seen the extent of the Fed rate repricing?

Markets have been mostly consolidating recent moves into Thursday. We’ve seen some profit taking on Dollar longs and renewed demand for US equities into the dip. Whether or not this holds up is a completely different story.
