![]()
Crude prices finally found some much-needed support on Monday after falling virtually in a straight line for the best part of two weeks. The general improvement in risk appetite was part of the reason why it bounced, especially since prices were severally oversold. In truth, speculators were merely looking for an excuse to book profit on their short positions and the unfortunate tragedy in Paris that led to retaliatory bombardments of IS targets in Syria, which raised supply-side risks in the Middle East region, gave them that excuse. But on Tuesday it seemed like traders have realised that fundamentally not a lot has changed. The French bombardment of IS targets are on the main away from most major oil terminals, and therefore they are unlikely to cause any actual disruptions to supply. So, oil prices continue to remain depressed by the still-high supply of the stuff and weaker demand prospects. On top of this, the dollar has found support from a weaker EUR/USD and firmer USD/JPY and USD/CHF pairs. FX traders have shrugged off the weakness in US industrial production and chose to focus on the Consumer Price Index, which showed a solid but expected 0.2% month-over-month increase. The CPI keeps the December rate hikes alive, barring an unexpectedly sharp downturn in the upcoming data releases from now until the FOMC’s meeting on December 16.
Traders’ focus will now shift to the upcoming US crude stockpiles reports from the American Petroleum Institute (Tuesday) and the Energy Information Administration (Wednesday). If these show further increases in oil inventories then oil prices may drop even more in the short term before we potentially see a rally. Conversely, we could see a noticeable rebound in prices if the API and EIA data show an unexpectedly sharp drawdown in crude inventories.
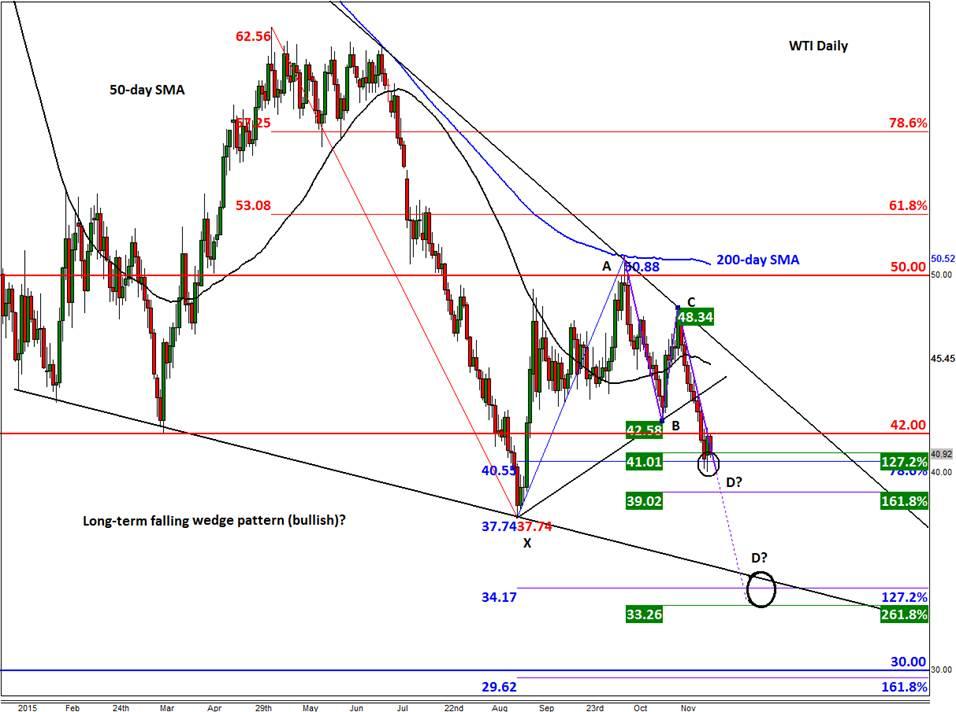
At the time of this writing, WTI was testing the point D of an AB=CD pattern at a Fibonacci convergence area between $40.50 (78.6% of XA) and $41.00 (127.2% of BC). In other words, there is the possibility for a Bullish Gartley pattern to form here, which can be quite significant if does. However if the selling does not stop here then WTI may initially drop to $37.75 – the August low – ahead of the extended point D around $34.00. There, it will meet the support trend of the falling wedge pattern and another set of Fibonacci extension levels as shown on the chart (i.e. this area is where a Bullish Butterfly pattern comes into play). In any case, while WTI remains below $42.00, the path of short-term least resistance would remain to the downside. If and when $42.00 breaks then a rally towards the upper trend of the falling wedge pattern may begin.
Figure 1:
Trading leveraged products such as FX, CFDs and Spread Bets carry a high level of risk which means you could lose your capital and is therefore not suitable for all investors. All of this website’s contents and information provided by Fawad Razaqzada elsewhere, such as on telegram and other social channels, including news, opinions, market analyses, trade ideas, trade signals or other information are solely provided as general market commentary and do not constitute a recommendation or investment advice. Please ensure you fully understand the risks involved by reading our disclaimer, terms and policies.
Recommended Content
Editors’ Picks
AUD/USD failed just ahead of the 200-day SMA

Finally, AUD/USD managed to break above the 0.6500 barrier on Wednesday, extending the weekly recovery, although its advance faltered just ahead of the 0.6530 region, where the key 200-day SMA sits.
EUR/USD met some decent resistance above 1.0700

EUR/USD remained unable to gather extra upside traction and surpass the 1.0700 hurdle in a convincing fashion on Wednesday, instead giving away part of the weekly gains against the backdrop of a decent bounce in the Dollar.
Gold keeps consolidating ahead of US first-tier figures

Gold finds it difficult to stage a rebound midweek following Monday's sharp decline but manages to hold above $2,300. The benchmark 10-year US Treasury bond yield stays in the green above 4.6% after US data, not allowing the pair to turn north.
Bitcoin price could be primed for correction as bearish activity grows near $66K area

Bitcoin (BTC) price managed to maintain a northbound trajectory after the April 20 halving, despite bold assertions by analysts that the event would be a “sell the news” situation. However, after four days of strength, the tables could be turning as a dark cloud now hovers above BTC price.
Bank of Japan's predicament: The BOJ is trapped

In this special edition of TradeGATEHub Live Trading, we're joined by guest speaker Tavi @TaviCosta, who shares his insights on the Bank of Japan's current predicament, stating, 'The BOJ is Trapped.'
