![]()
Last Monday we wrote an article on the USD/CHF, suggesting that the pair was on the verge of a move towards and beyond parity. Then, the Swissy was testing a key support area between 0.9800 and 0.9840 ahead of important US economic data, which included Friday’s – what turned out to be a stellar – monthly jobs report. Thanks to the improvement in US data and continued hawkish talk from the Fed, the USD has surged higher since the start of the month, lifting the USD/CHF to above and beyond parity as we had envisaged. So far this week it has been a bit of a US data void, but as my colleague Matt Weller suggested earlier there will be no less than six separate Fed speakers on Thursday to provide some further hints on monetary policy, ahead of Friday’s key US retail sales report.
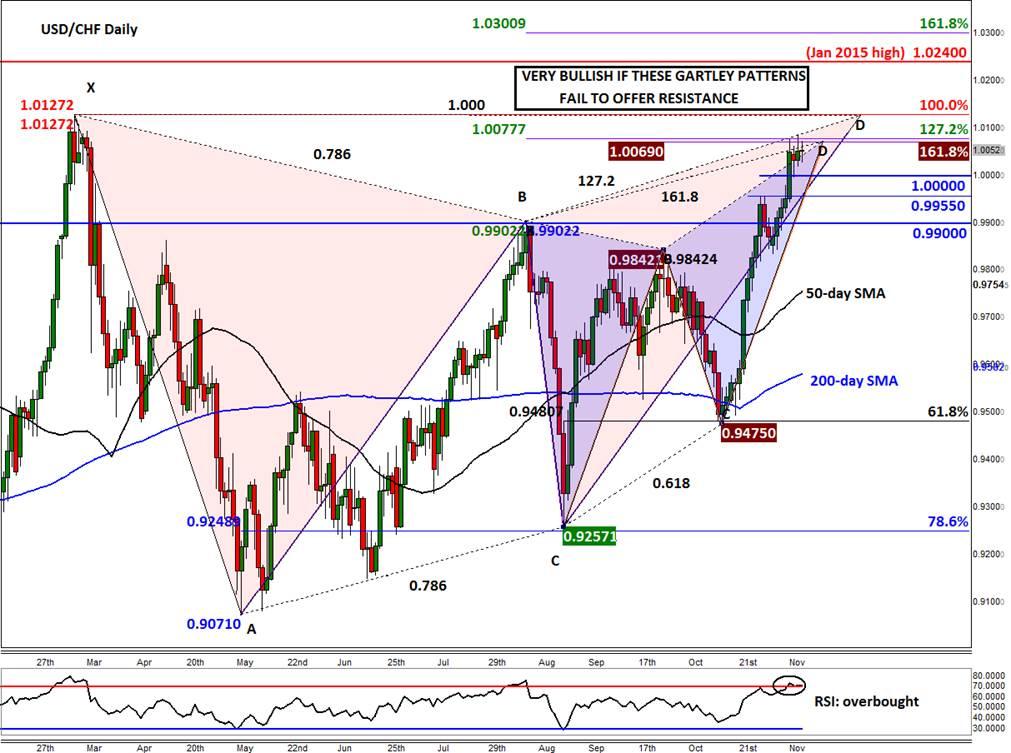
Understandably, the dollar has paused for breath following such a strong rally over the past several days, though at just 90 pips shy of 100, the Dollar Index is looking strong having broken the previous resistance at 98.60. As far as the USD/CHF is concerned, the unit is now not too far off the earlier 2015 high of 1.0240, a level that was printed just a day before when the SNB removed the EUR/CHF 1.20 floor on January 15. But standing on the way to that level is the convergence of two separate Bearish Gartley patterns between 1.0075 and 1.0125. In fact we highlighted this as a potential resistance area last Monday. Sure enough, as can be seen on the updated chart, the Swissy has stalled here for the time being. But as mentioned last week, while we would normally be looking for signs of weakness here, in this case, we would be looking for a potential breakout due to our fundamental bullish views. If realised, then significantly higher levels could be achieved as some of the existing sellers rush for the exits, starting with the Fibonacci-based targets at 1.0300 (161.8% of BC price swing). However if the sellers emerge here and price moves back below parity then there is potential for a sizeable correction. The immediate supports below 1.0000 are at 0.9955, followed by 0.9900 and then the 50-day SMA at 0.9755.
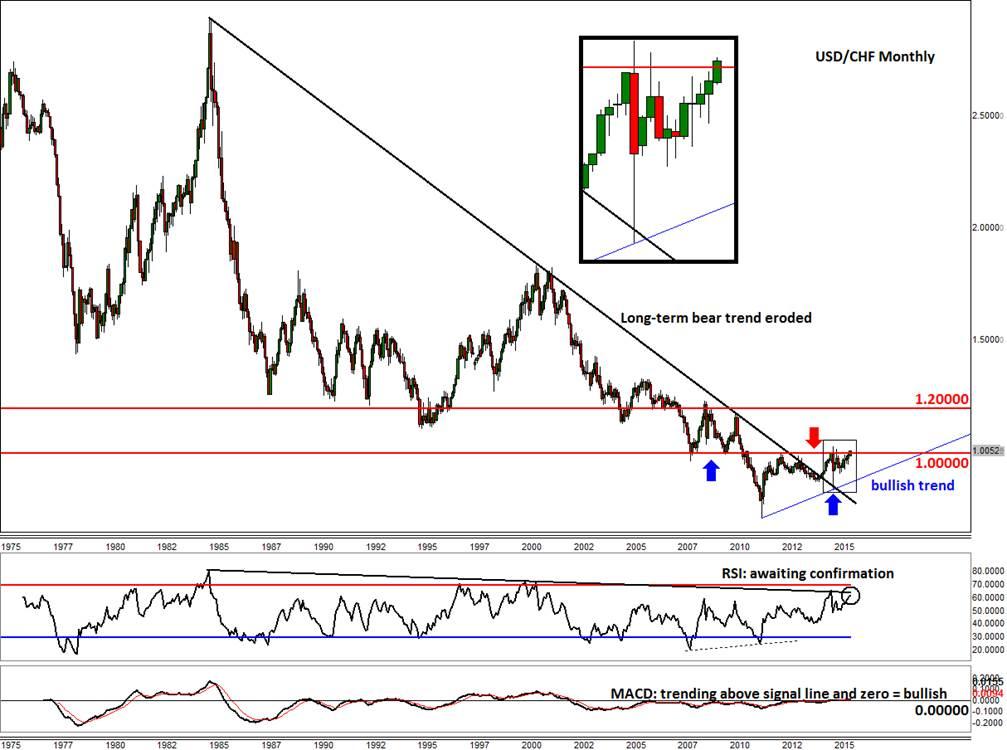
The updated monthly chart of the Swissy meanwhile is now looking even more bullish. As mentioned last week, a trend line that goes back all the way to the year 1985 has been broken down already in the summer of 2014. Since then, the USD/CHF has had a couple of attempts to break decisively above the previous support-turned-resistance at 1.0000. These attempts have proved futile so far, but the corresponding sell-offs have been progressively shallower. The most notable drop below parity was at the start of this year of course when the SNB abandoned its 1.20 EUR/CHF floor. That drop caused havoc in the market. But amidst the chaos there was in fact some order as the USD/CHF found support from the upper side of its long-term bullish trend line, around 0.8400. Consequently, higher lows and thus a bullish trend line have since been established. Meanwhile the secondary momentum indicators are both pointing higher: the MACD is above zero and the signal line, while the RSI is hovering around the key 60 level. The latter is yet to break its own long-term bearish trend; it will need to do this in order to confirm the breakout in the USD/CHF. If the Swissy is able to sustain itself above parity then an eventual move towards 1.20 could get underway soon.
Figure 1:
Figure 2:
Trading leveraged products such as FX, CFDs and Spread Bets carry a high level of risk which means you could lose your capital and is therefore not suitable for all investors. All of this website’s contents and information provided by Fawad Razaqzada elsewhere, such as on telegram and other social channels, including news, opinions, market analyses, trade ideas, trade signals or other information are solely provided as general market commentary and do not constitute a recommendation or investment advice. Please ensure you fully understand the risks involved by reading our disclaimer, terms and policies.
Recommended Content
Editors’ Picks
EUR/USD clings to daily gains above 1.0650

EUR/USD gained traction and turned positive on the day above 1.0650. The improvement seen in risk mood following the earlier flight to safety weighs on the US Dollar ahead of the weekend and helps the pair push higher.
GBP/USD recovers toward 1.2450 after UK Retail Sales data

GBP/USD reversed its direction and advanced to the 1.2450 area after touching a fresh multi-month low below 1.2400 in the Asian session. The positive shift seen in risk mood on easing fears over a deepening Iran-Israel conflict supports the pair.
Gold holds steady at around $2,380 following earlier spike

Gold stabilized near $2,380 after spiking above $2,400 with the immediate reaction to reports of Israel striking Iran. Meanwhile, the pullback seen in the US Treasury bond yields helps XAU/USD hold its ground.
Bitcoin Weekly Forecast: BTC post-halving rally could be partially priced in Premium

Bitcoin price shows no signs of directional bias while it holds above $60,000. The fourth BTC halving is partially priced in, according to Deutsche Bank’s research.
Week ahead – US GDP and BoJ decision on top of next week’s agenda

US GDP, core PCE and PMIs the next tests for the Dollar. Investors await BoJ for guidance about next rate hike. EU and UK PMIs, as well as Australian CPIs also on tap.
