![]()
Gold has found some support from a slightly weaker US dollar and equity markets, though it remains to be seen how these assets will behave during and after the ECB’s press conference on Thursday. The EUR/USD could fall sharply if Mario Draghi talks up the possibility of expanding the size and duration of its asset purchases programme. This scenario should be good news for stocks and the dollar, and bad for the buck-denominated gold. On the other hand, if Mr Draghi dismisses the prospects of further intervention, perhaps on grounds that it is far too early to alter QE, then opposite could happen. So, a lot hinges on this ECB press conference. Unfortunately as there won’t be any other significant macro events in the interim, it could be a long wait until Thursday afternoon.
Meanwhile from a technical point of view, while gold is continuing to make decent progress, the bulls will need to step up their game in order to push it through some strong resistance areas that are either approaching or being tested.
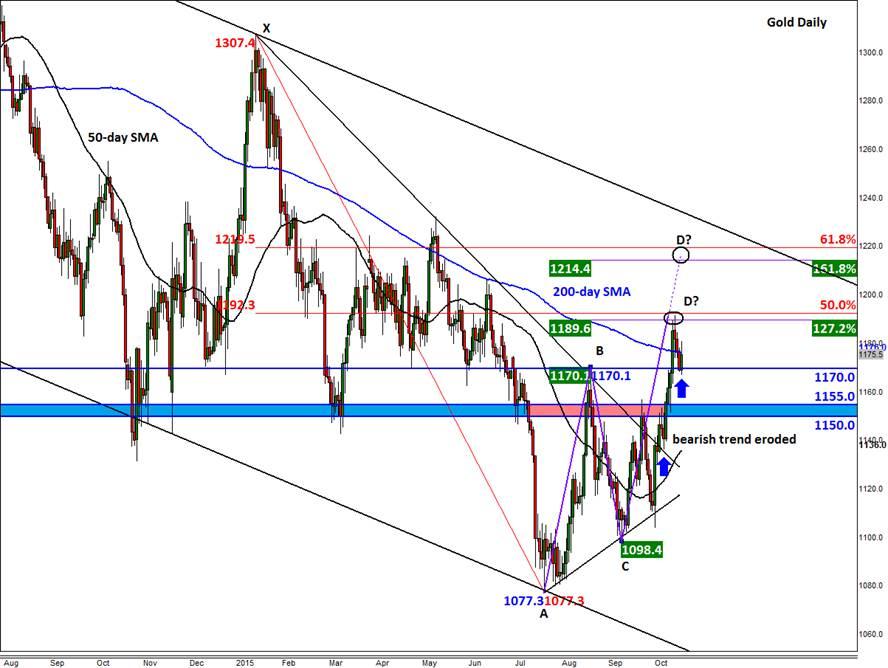
The precious metal has for now managed to bounce off the old resistance at $1170. At the end of last week, it failed to hold its own above the 200-day moving average ($1176) as it found strong resistance around $1190, where a Bearish Gartley/Bat pattern completes. As the daily chart shows, this area marks the convergence of point D of an AB=CD formation with two Fibonacci levels i.e. the 50% retracement of XA and 127.2% extension of BC price swings.
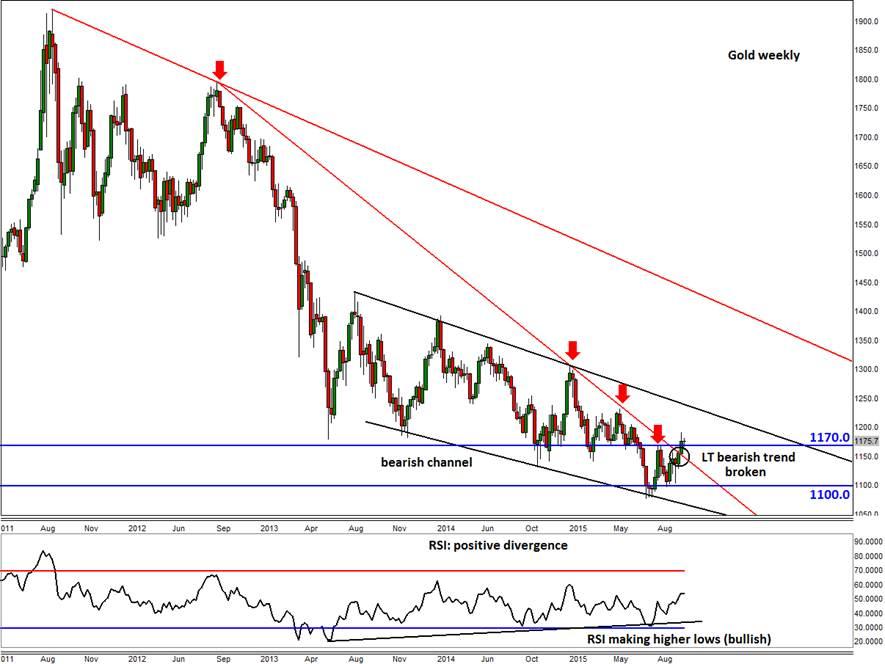
It is obvious that the bulls will want to see gold make a sustained break above the 200-day moving average, but this won’t happen unless the abovementioned Gartley pattern becomes invalid. Even so, there is an extended point D and a more significant Bearish Gartley entry point at around $1215/20 (area circled on the daily chart). This is where the 61.8% retracement of XA and 161.8% extension of BC price swings converge. What’s more, while the breakdown of the long-term bearish trend line as shown on the weekly chart is a bullish development, gold still resides within a bearish channel. The resistance trend of this channel comes in around the $1220/30 area.
So, bullish traders may want to proceed with extra caution until such a time we potentially clear these technically-important levels.
But in order to break these levels down we will need to see some significant deterioration in US dollar and/or risk appetite. The bears meanwhile will now want to first and foremost see a decisive break below the $1170 support level. If realised, this would raise a few question marks over gold’s recent bullish indications and price action, causing some traders to cover their long positions. The bullish technical outlook would become even shakier upon a decisive break back below the $1150 handle. In this scenario, gold may then drop back towards its 50-day SMA, currently at $1136, before deciding on its next move.
Figure 1:
Figure 2:
Trading leveraged products such as FX, CFDs and Spread Bets carry a high level of risk which means you could lose your capital and is therefore not suitable for all investors. All of this website’s contents and information provided by Fawad Razaqzada elsewhere, such as on telegram and other social channels, including news, opinions, market analyses, trade ideas, trade signals or other information are solely provided as general market commentary and do not constitute a recommendation or investment advice. Please ensure you fully understand the risks involved by reading our disclaimer, terms and policies.
Recommended Content
Editors’ Picks
AUD/USD posts gain, yet dive below 0.6500 amid Aussie CPI, ahead of US GDP

The Aussie Dollar finished Wednesday’s session with decent gains of 0.15% against the US Dollar, yet it retreated from weekly highs of 0.6529, which it hit after a hotter-than-expected inflation report. As the Asian session begins, the AUD/USD trades around 0.6495.
USD/JPY finds its highest bids since 1990, approaches 156.00

USD/JPY broke into its highest chart territory since June of 1990 on Wednesday, peaking near 155.40 for the first time in 34 years as the Japanese Yen continues to tumble across the broad FX market.
Gold stays firm amid higher US yields as traders await US GDP data

Gold recovers from recent losses, buoyed by market interest despite a stronger US Dollar and higher US Treasury yields. De-escalation of Middle East tensions contributed to increased market stability, denting the appetite for Gold buying.
Ethereum suffers slight pullback, Hong Kong spot ETH ETFs to begin trading on April 30

Ethereum suffered a brief decline on Wednesday afternoon despite increased accumulation from whales. This follows Ethereum restaking protocol Renzo restaked ETH crashing from its 1:1 peg with ETH and increased activities surrounding spot Ethereum ETFs.
Dow Jones Industrial Average hesitates on Wednesday as markets wait for key US data

The DJIA stumbled on Wednesday, falling from recent highs near 38,550.00 as investors ease off of Tuesday’s risk appetite. The index recovered as US data continues to vex financial markets that remain overwhelmingly focused on rate cuts from the US Fed.
