![]()
By far, the most common question I receive on twitter and in my weekly webinars is, “what’s the trend in XXX market?” While this line of questioning certainly represents an improvement over the blind I’ve-got-a-feeling-and-am-going-to-take-a-punt attitude that many new traders adopt, it is nonetheless an impossible question to answer. There is never one singular, exclusive trend in the market; the trend can only be defined relative to a certain timeframe.
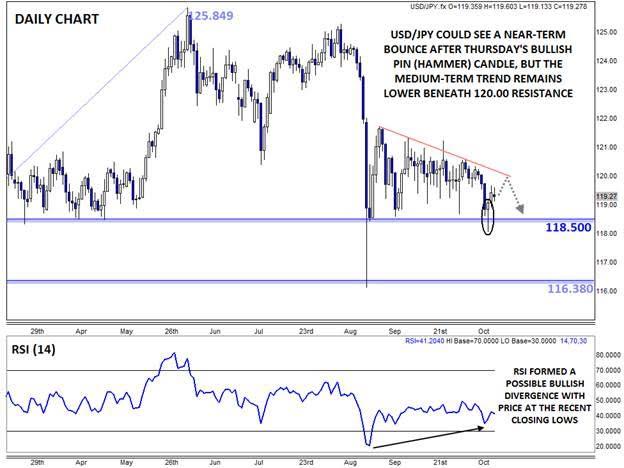
A clear example of this messy, nuanced view of trends comes from USD/JPY. Over a long-term horizon, the trend is clearly higher, as the pair has been putting in higher highs and higher lows since bottoming under 80.00 back in October 2011. Zooming in though, you could argue that the near-term trend is actually lower over the last few months. Since peaking near 125.80 in early June, USD/JPY has been steadily falling to test strong support in the 118.50. Finally, on an intraday level, the outlook is more optimistic, with potential for a very short-term uptrend to form on the way back up to bearish trend line resistance at 120.00.
From a technical perspective, there are two main reasons for near-term optimism. First, USD/JPY formed a clear Bullish Pin Candle*, or hammer, pattern off the key 118.50 support level on Thursday. This formation, which was also seen in a number of other USD crosses, shows an intraday shift from selling to buying pressure and often marks a near-term bottom in price. Secondly, the pair also saw a potential bullish divergence with the RSI indicator at Thursday’s low (note that the RSI indicator is based off closing prices, not intraday prices).
These technical developments hint at a potential bounce in USD/JPY early this week, but it’s important to note that this view doesn’t mean that “the” trend has shifted back higher. From the perspective of a swing trader, who holds trades for a week or more, it may make more sense to wait to see whether a short-term rally back toward 120.00 emerges, then look to fade it for a possible move back toward 118.50 support or below. From a fundamental perspective, it’s shaping up to be a quiet week for USD/JPY, with only brief comments from Fed Chair Janet Yellen on Tuesday and other Fedspeak to serve as near-term catalysts.
* A Bullish Pin (Pinnochio) candle, also known as a hammer or paper umbrella, is formed when prices fall within the candle before buyers step in and push prices back up to close near the open. It suggests the potential for a bullish continuation if the high of the candle is broken.
This research is for informational purposes and should not be construed as personal advice. Trading any financial market involves risk. Trading on leverage involves risk of losses greater than deposits.
Recommended Content
Editors’ Picks
AUD/USD failed just ahead of the 200-day SMA

Finally, AUD/USD managed to break above the 0.6500 barrier on Wednesday, extending the weekly recovery, although its advance faltered just ahead of the 0.6530 region, where the key 200-day SMA sits.
EUR/USD met some decent resistance above 1.0700

EUR/USD remained unable to gather extra upside traction and surpass the 1.0700 hurdle in a convincing fashion on Wednesday, instead giving away part of the weekly gains against the backdrop of a decent bounce in the Dollar.
Gold keeps consolidating ahead of US first-tier figures

Gold finds it difficult to stage a rebound midweek following Monday's sharp decline but manages to hold above $2,300. The benchmark 10-year US Treasury bond yield stays in the green above 4.6% after US data, not allowing the pair to turn north.
Bitcoin price could be primed for correction as bearish activity grows near $66K area

Bitcoin (BTC) price managed to maintain a northbound trajectory after the April 20 halving, despite bold assertions by analysts that the event would be a “sell the news” situation. However, after four days of strength, the tables could be turning as a dark cloud now hovers above BTC price.
Bank of Japan's predicament: The BOJ is trapped

In this special edition of TradeGATEHub Live Trading, we're joined by guest speaker Tavi @TaviCosta, who shares his insights on the Bank of Japan's current predicament, stating, 'The BOJ is Trapped.'
