![]()
Another exciting week of trading is drawing to a close and after some downbeat US macro pointers earlier in the week, investors’ expectations about the timing of a Federal Reserve rate rise was pushed further out. As a result, the dollar fell while stocks rallied on hopes of lower interest rates for longer in the US and fresh easing elsewhere, most notably China. The weaker dollar helped to boost the price of gold, too. However, the slightly stronger-than-expected core CPI print and a sharp drop in weekly unemployment claims on Thursday as well as an unexpectedly sharp improvement in consumer sentiment as reported by the UoM today caused the dollar to stabilise a little. Consequently, gold’s rally has come to a bit of a halt. Clearly, some traders are also booking profit ahead of the weekend and this is applying additional pressure.
As we reported earlier this week, the precious metal’s technical outlook has improved significantly (see “Golden times ahead for the yellow precious metal?” for more). While I am still bullish on gold in the short term and as tempting as it might be to think that it has found a bottom, this is not the first time we have seen such a bullish-looking breakout that has ultimately proved to be a mere short-covering rally. This time of course the slightly deprecating US dollar has supported the rally, but with the world’s other major central banks still being extremely dovish, the US currency could come back to life quite quickly and weigh on the buck-denominated gold.
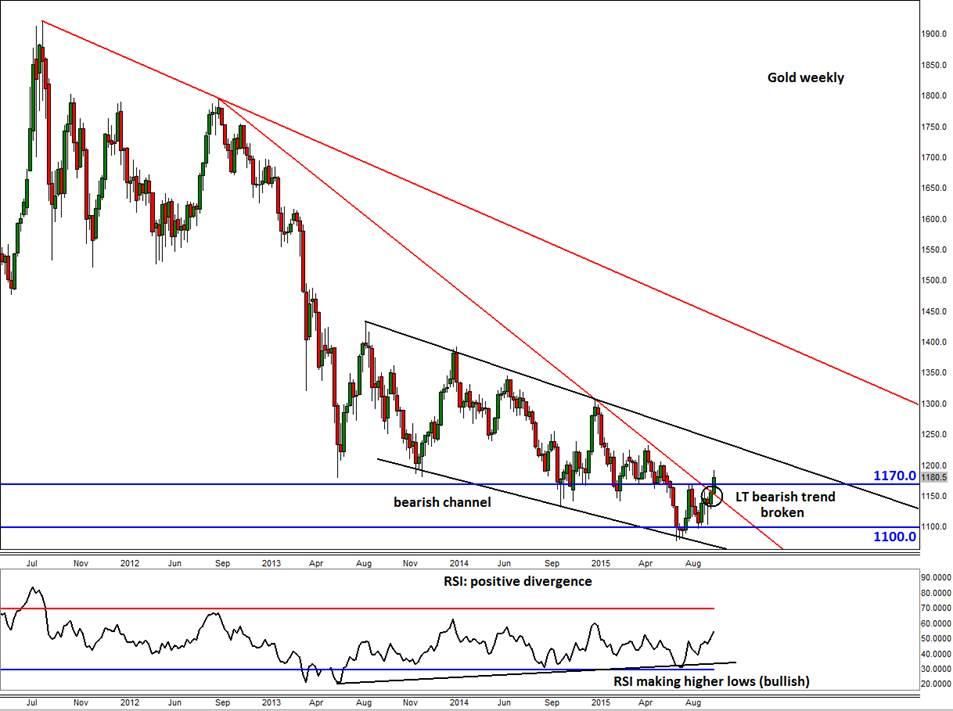
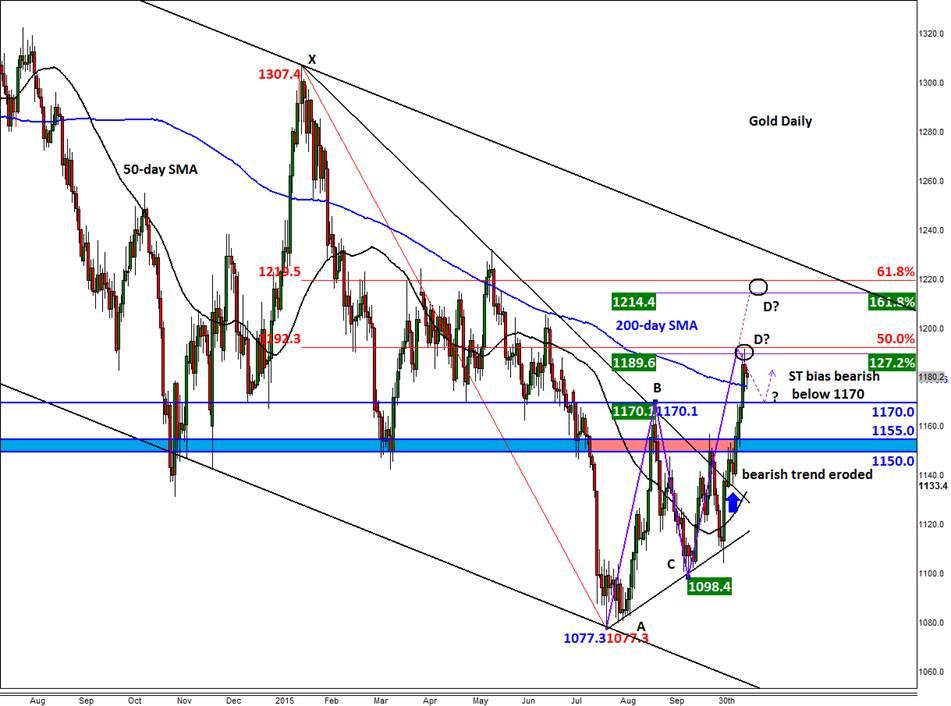
The breakdown of the long-term bearish trend line and resistance at $1170, as shown on the weekly chart, is clearly a bullish development for gold. But the precious metal still resides within a bearish channel and until/unless it breaks out of this too then one should proceed with extra caution. Indeed, as the daily chart shows, it has already arrived at the first of our two key short-term bullish targets, namely $1190. This level corresponds with a Bearish Gartley/Bat pattern in that it marks the convergence of point D of an AB=CD formation with two Fibonacci levels i.e. the 50% retracement of XA and 127.2% extension of BC price swings. The extended point D and a more significant Bearish Gartley entry point is at around $1215/20 (which is our second bullish target – area circled on the daily chart). This is where the 61.8% retracement of XA and 161.8% extension of BC price swings converge. The resistance trend of the long-term bearish channel would come in around the $1220/30 area, depending on the speed of the potential rally.
The bears meanwhile will first and foremost want to see gold stall at around the abovementioned resistance levels and then break below the 200-day SMA, currently at $1176, on a closing basis. The bullish technical outlook would become invalid upon a decisive break back below the $1150 handle. In this scenario, gold may then drop back towards its 50-day SMA, currently at $1133, before deciding on its next move.
Figure 1:
Figure 2:
Trading leveraged products such as FX, CFDs and Spread Bets carry a high level of risk which means you could lose your capital and is therefore not suitable for all investors. All of this website’s contents and information provided by Fawad Razaqzada elsewhere, such as on telegram and other social channels, including news, opinions, market analyses, trade ideas, trade signals or other information are solely provided as general market commentary and do not constitute a recommendation or investment advice. Please ensure you fully understand the risks involved by reading our disclaimer, terms and policies.
Recommended Content
Editors’ Picks
EUR/USD clings to daily gains above 1.0650

EUR/USD gained traction and turned positive on the day above 1.0650. The improvement seen in risk mood following the earlier flight to safety weighs on the US Dollar ahead of the weekend and helps the pair push higher.
GBP/USD recovers toward 1.2450 after UK Retail Sales data

GBP/USD reversed its direction and advanced to the 1.2450 area after touching a fresh multi-month low below 1.2400 in the Asian session. The positive shift seen in risk mood on easing fears over a deepening Iran-Israel conflict supports the pair.
Gold holds steady at around $2,380 following earlier spike

Gold stabilized near $2,380 after spiking above $2,400 with the immediate reaction to reports of Israel striking Iran. Meanwhile, the pullback seen in the US Treasury bond yields helps XAU/USD hold its ground.
Bitcoin Weekly Forecast: BTC post-halving rally could be partially priced in Premium

Bitcoin price shows no signs of directional bias while it holds above $60,000. The fourth BTC halving is partially priced in, according to Deutsche Bank’s research.
Week ahead – US GDP and BoJ decision on top of next week’s agenda

US GDP, core PCE and PMIs the next tests for the Dollar. Investors await BoJ for guidance about next rate hike. EU and UK PMIs, as well as Australian CPIs also on tap.

