![]()
The US Dollar is lower once again today, with the GBP/USD rallying on the back of news UK’s employment rate hit the best level since records began in 1971 while the rate of unemployment fell to the lowest since 2008. The EUR/USD has also risen while the USD/JPY has weakened, apparently on the unwinding of the carry trades as stocks have ended their recent good run of form. The dollar could move sharply this week for not only do we have lots of US macroeconomic data to look forward to but some key earnings results too, most notably from large Wall Street banks. Although there wasn’t much in the way of US macroeconomic data on earlier this week, things should pick up from today onwards as we will have the latest retail sales and PPI figures later this afternoon. Thursday will see the release of the monthly headline and core CPI estimates; the Empire State and Philly Fed manufacturing indices, and the usual weekly unemployment claims figures. Friday’s key macro data will include the UoM Consumer Sentiment, JOLTS Job Openings, Industrial Production and Capacity Utilization Rate. So, there will be plenty of data this week to hopefully provide clear direction for the dollar.
Given their current positive correlation, if the upcoming US data inspires a sharp move in the USD/JPY pair then stocks could follow suit. So, it could be a very important week for both the USD/JPY and the stock markets. In fact, Wall Street already closed lower yesterday following the weaker Chinese trade figures and as earnings from Johnson & Johnson disappointed. JP Morgan also missed the expectations after the close. The major US indices posted bearish-looking candlestick formations on their daily charts and if we see some follow-through in the selling pressure today then this would bode ill for the USD/JPY pair in particular.
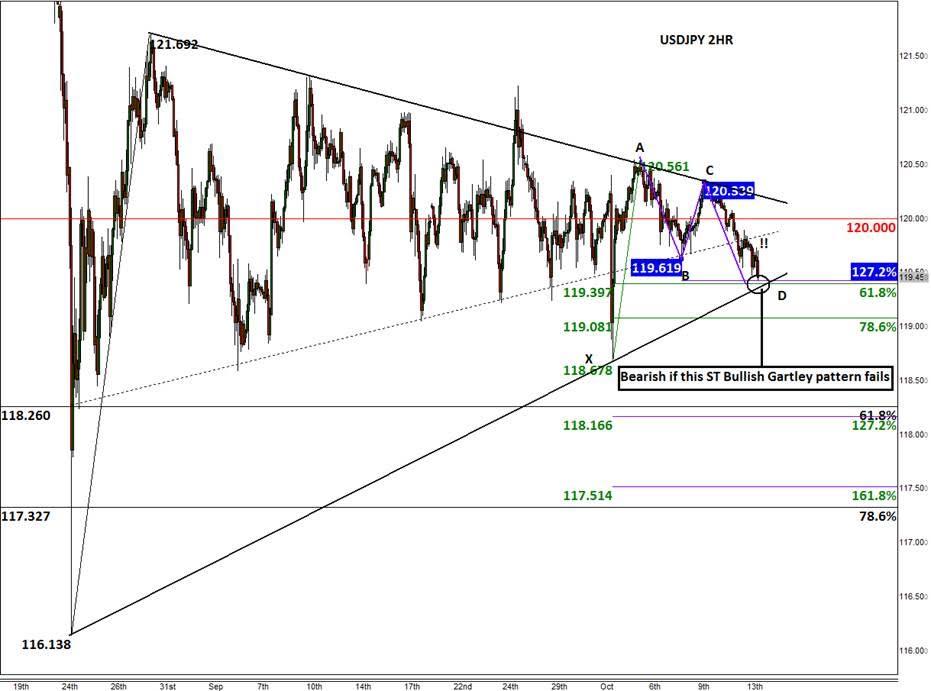
Indeed, the USD/JPY could fall sharply if the buyers fail to defend a key support area around 119.30/60. As can be seen from the 2-hour chart, below, this is where the support trend of a consolidative triangle pattern meets the point D of an AB=CD pattern. In addition, two sets of Fibonacci levels converge here (i.e. the 61.8% retracement of XA with 127.2% extension of BC). In other words, there is a potential short-term Bullish Gartley pattern entry point around 119.30/60. However, given that the USD/JPY has already taken out another bullish trend line (dotted line, on the chart), there is an increased risk we may see a breakdown here too. If seen, the USD/JPY bears may initially target the previous low at 118.65/75 (point X) followed by the slightly longer-term 61.8% Fibonacci retracement level at 118.25.
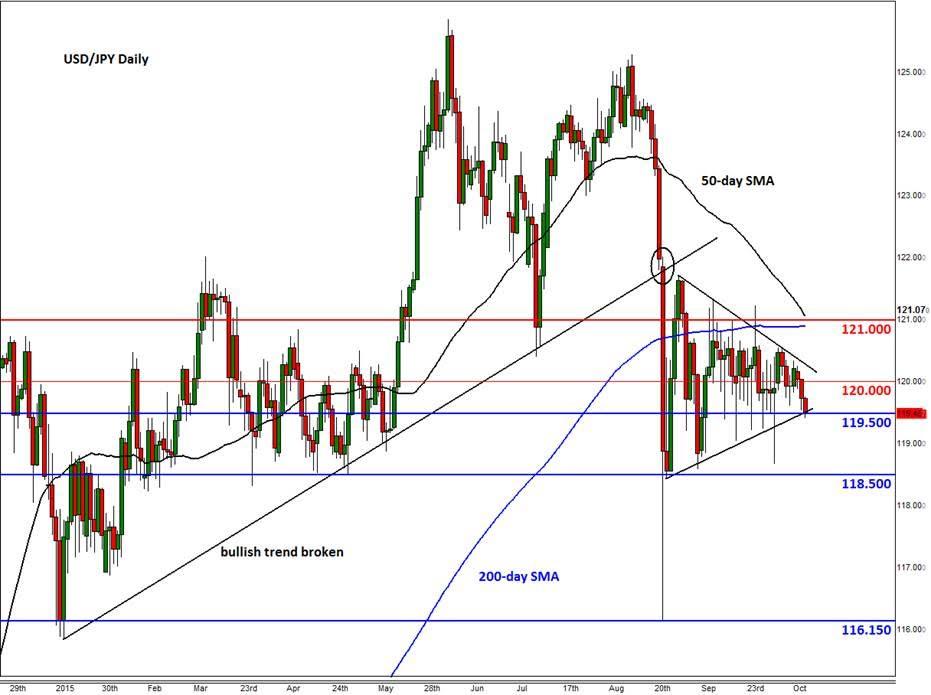
Meanwhile the daily chart of the USD/JPY reveals another important support at 118.50, a level where the USD/JPY has held above on a daily closing basis since February this year. Thus, a closing break below 118.50 would be a particularly bearish development which could see the USD/JPY head for the August low around 116.10/15 at the very least. Needless to say, a decisive break above the triangle pattern would be a bullish development, though this potential outlook seems less likely at this stage.
Figure 1:
Figure 2:
Trading leveraged products such as FX, CFDs and Spread Bets carry a high level of risk which means you could lose your capital and is therefore not suitable for all investors. All of this website’s contents and information provided by Fawad Razaqzada elsewhere, such as on telegram and other social channels, including news, opinions, market analyses, trade ideas, trade signals or other information are solely provided as general market commentary and do not constitute a recommendation or investment advice. Please ensure you fully understand the risks involved by reading our disclaimer, terms and policies.
Recommended Content
Editors’ Picks
AUD/USD pressures as Fed officials hold firm on rate policy

The Australian Dollar is on the defensive against the US Dollar, as Friday’s Asian session commences. On Thursday, the antipodean clocked losses of 0.21% against its counterpart, driven by Fed officials emphasizing they’re in no rush to ease policy. The AUD/USD trades around 0.6419.
EUR/USD extends its downside below 1.0650 on hawkish Fed remarks

The EUR/USD extends its downside around 1.0640 after retreating from weekly peaks of 1.0690 on Friday during the early Asian session. The hawkish comments from Federal Reserve officials provide some support to the US Dollar.
Gold price edges higher on risk-off mood hawkish Fed signals

Gold prices advanced late in the North American session on Thursday, underpinned by heightened geopolitical risks involving Iran and Israel. Federal Reserve officials delivered hawkish messages, triggering a jump in US Treasury yields, which boosted the Greenback.
Runes likely to have massive support after BRC-20 and Ordinals frenzy

With all eyes peeled on the halving, Bitcoin is the center of attention in the market. The pioneer cryptocurrency has had three narratives this year already, starting with the spot BTC exchange-traded funds, the recent all-time high of $73,777, and now the halving.
Billowing clouds of apprehension

Thursday marked the fifth consecutive session of decline for US stocks as optimism regarding multiple interest rate cuts by the Federal Reserve waned. The downturn in sentiment can be attributed to robust economic data releases, prompting traders to adjust their expectations for multiple rate cuts this year.

