![]()
The USD/JPY currency pair may go on to rise to significantly higher levels over time because of the growing disparity between interest rates in the US and Japan. But in the immediate near term, the risks for a potential correction are high given the extent of the recent upsurge. Traders may simply choose to book some profit now following a 5-day rally. This, combined with the potential withdrawal of bids near key resistance levels, may cause price to collapse under its own weight. In fact, the USD/JPY has now risen for 10 out of the past eleven days. This streak cannot be sustained for ever and sooner or later it will come to an end. Could now be that time?
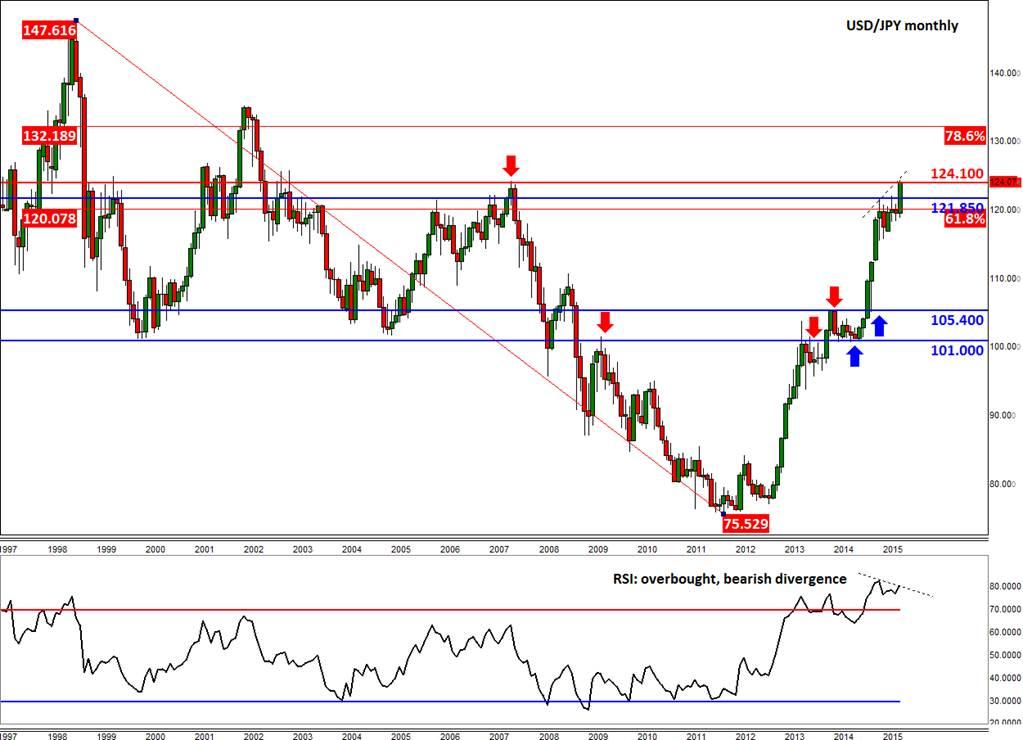
Below we have two charts of the USD/JPY: the monthly and the daily. The RSI on both charts is holding above the overbought threshold of greater than 70. On the monthly chart, the RSI has actually formed a small bearish divergence (lower high vs. higher high on the underlying price) which suggests that the bullish momentum has weakened in recent months compared to a year or so ago and that it may be due a sharp pullback. But the RSI is not at these extreme levels by fluke; it is there because of solid fundamental reasons which have created strong bullish trends in the underlying USD/JPY currency pair. Thus, RSI on its own at “overbought” levels does not necessarily mean a major pullback is imminent; it could remain overbought for extended periods of time. Nevertheless it does serve as a warning, so it should not be dismissed easily either, especially when the underlying asset – in this case the USD/JPY – has reached potential resistance or exhaustion levels. Indeed, as the monthly chart shows, the USD/JPY has now reached and momentarily surpassed the 2007 peak of around 124.10. This would have been a target for some exiting bulls who may now choose to book (some) profit on their positions. In other words, there could be more offers than bids around this area from shrewd speculators. This may help keep a lid on the price for the time being.
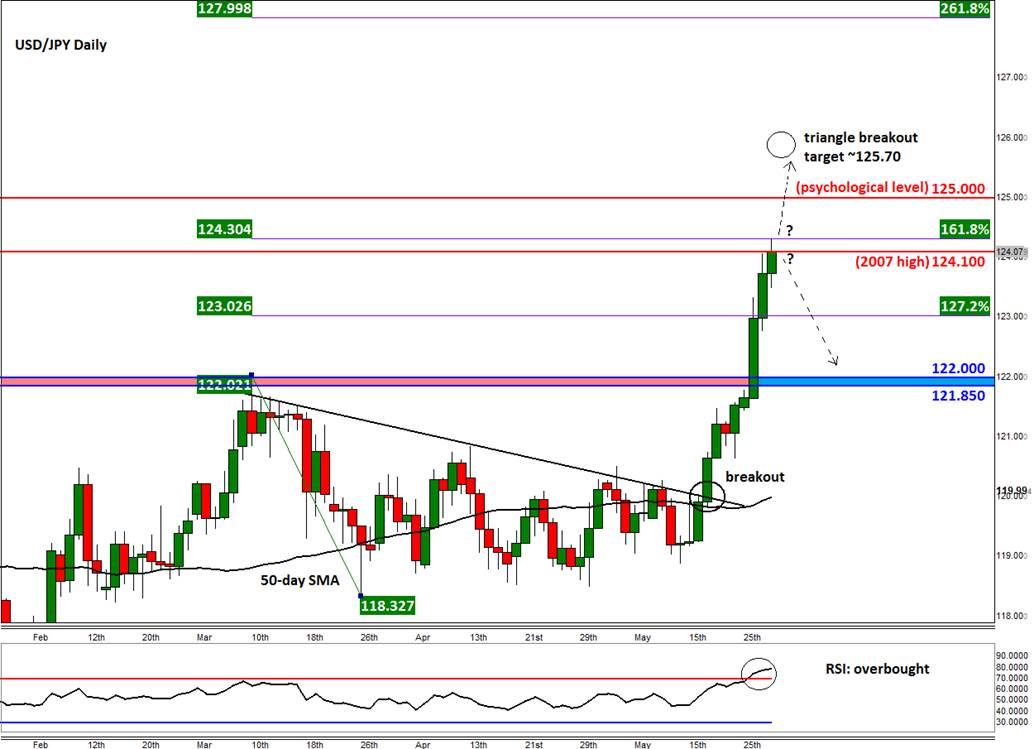
Meanwhile the daily chart shows that price may have potentially reached an exhaustion point: the 161.8% Fibonacci extension level of the most recent downswing that we saw in March, at 124.30. Evidently, there were some offers around this level too, which, as can be seen on the chart, has caused the USD/JPY to retreat slightly. It is way too early to say whether this level will hold as resistance for a significant amount of time, but the potential is there. From here, price could potentially drop all the way back to the prior resistance area of 121.85/122.00 before making its next move. Obviously there will be several other intra-day support levels that one will need to watch on their intra-day charts, but this will be the key support if and when price gets there.
It should be noted however that the fundamental outlook for the USD/JPY remains bullish. Therefore if the currency pair clears the abovementioned resistance area – especially with relative ease – then a major continuation could be underway. In this scenario, price may easily extend its gains to reach the psychologically-important level of 125.00 or the triangle breakout target of 125.70. Indeed it is even possible for price to rally all the way to the 261.8% Fibonacci extension level at 128.00 before deciding on its next move.
In summary, there is a potential for a pullback of some sort around the 124.00 area because of profit-taking, above all. But as the long term fundamental outlook remains bullish for the USD/JPY, price is likely to clear this area eventually; when will this happen is a million dollar question. But what this means for speculators is that there will be plenty of trading opportunities to look forward to. One should let price determine the direction and then trade accordingly.
Trading leveraged products such as FX, CFDs and Spread Bets carry a high level of risk which means you could lose your capital and is therefore not suitable for all investors. All of this website’s contents and information provided by Fawad Razaqzada elsewhere, such as on telegram and other social channels, including news, opinions, market analyses, trade ideas, trade signals or other information are solely provided as general market commentary and do not constitute a recommendation or investment advice. Please ensure you fully understand the risks involved by reading our disclaimer, terms and policies.
Recommended Content
Editors’ Picks
AUD/USD risks a deeper drop in the short term

AUD/USD rapidly left behind Wednesday’s decent advance and resumed its downward trend on the back of the intense buying pressure in the greenback, while mixed results from the domestic labour market report failed to lend support to AUD.
EUR/USD leaves the door open to a decline to 1.0600

A decent comeback in the Greenback lured sellers back into the market, motivating EUR/USD to give away the earlier advance to weekly tops around 1.0690 and shift its attention to a potential revisit of the 1.0600 neighbourhood instead.
Gold is closely monitoring geopolitics

Gold trades in positive territory above $2,380 on Thursday. Although the benchmark 10-year US Treasury bond yield holds steady following upbeat US data, XAU/USD continues to stretch higher on growing fears over a deepening conflict in the Middle East.
Bitcoin price shows strength as IMF attests to spread and intensity of BTC transactions ahead of halving

Bitcoin (BTC) price is borderline strong and weak with the brunt of the weakness being felt by altcoins. Regarding strength, it continues to close above the $60,000 threshold for seven weeks in a row.
Is the Biden administration trying to destroy the Dollar?

Confidence in Western financial markets has already been shaken enough by the 20% devaluation of the dollar over the last few years. But now the European Commission wants to hand Ukraine $300 billion seized from Russia.

