![]()
Precious metals have staged a sharp, unexpected, rally today. Gold hit an intraday low of around $1178 before climbing to a high so far of $1204. That is a jump of $26 or 2.2 per cent. Characteristically, silver’s upsurge has been even more pronounced with the grey metal having already climbed 4.9 per cent off its low. So, what is going on? Much has been said about the risks of Greece exiting the euro zone lately. Yet, while the equity markets have, from time to time, responded to these concerns, there have been hardly any reaction from the precious metals in this regard. In fact, both metals are still significantly below their respective highs achieved earlier in the year; in the meantime, “Grexit” worries have increased by many folds. Why then all of a sudden should the metals find safe haven demand? After all, much of the Grexit risks appear to be a concern for domestic investors, with Greek bond yields rising and equity markets falling. In contrast, most of the European stock markets are hovering near fresh multi-year highs while some indices (including the DAX and FTSE) have hit repeated all-time highs this year. In other words, gold’s upsurge today cannot be solely explained by increased worries over Greece. In fact, Grexit worries may have receded somewhat, as evidenced for example by a drop in Greek bond yields this afternoon when news emerged that Greece has reshuffled its team responsible for negotiating debt structuring with the IMF and EU. If the news is correct, it means Finance Minister Yanis Varoufakis would be withdrawn from the front line of discussions and the hope is that this will help accelerate the progress from here.
So, if Greece is not the main reason for today’s upsurge in precious metals then what could it be? Well, the dollar could be a good place to start. The US currency has fallen for two consecutive weeks now and has started this one on the back foot, too. Up until today, the buck-denominated metals were not responding much to the dollar’s movements. But the pressure from this source may have gotten too strong to ignore, so the reluctant bears may have been forced to let go of some of their bearish positions. Indeed, as the CFTC’s positioning data showed on Friday, traders have been increasing their bearish bets on silver quite sharply of late. In the week to April 21 net long positions were more than halved, putting them at their lowest level since November 2014. As the price of silver extended its losses since April 21, it is likely that these speculators took profit and trimmed their positions by buying back the equivalent number of contracts. Thus, profit-taking from this group of market participants may have been a big reason behind today’s rally. The CFTC’s data on Friday should shed some light into this view.With US data generally disappointing expectations, the risks are that the Fed may deliver a particularly dovish policy statement on Wednesday. If seen, this could cause more pain for the dollar and more gain for some buck-denominated assets like gold and silver.
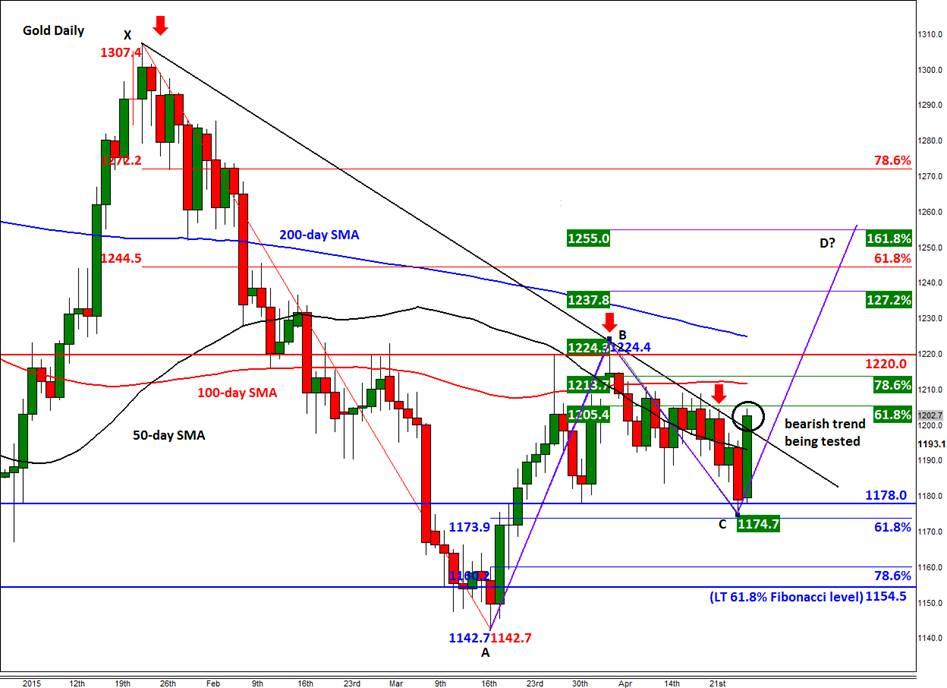
As a result of today’s rally, gold’s technical outlook appears more constructive all of a sudden. As the daily chart shows in figure 1, gold is currently trying to hold above a bearish trend line that has been in place since the start of the year, around $1200. A decisive break above this trend line would be a bullish outcome, which may pave the way for a move towards $1245 or even $1255 in the near term. The former corresponds with the 61.8% Fibonacci retracement of the downswing from the January peak (point X), while the latter is the 161.8% extension of the downswing from the April high (point B). Meanwhile the projected point D of an AB=CD pattern also comes in around the 61.8% Fibonacci level at $1255. In others, $1255 marks the point D of a potential Bearish Gartley pattern. But to get to that potentially bearish entry point, price will first have to take out several other resistances in the process. These include among other things the 100-day moving average at $1211, horizontal resistance at $1220 and the 200-day SMA at $1225. If however gold fails to clear the bearish trend line then we may see a swift drop back towards the 50-day SMA at $1193, followed by the $1178/80 support area.
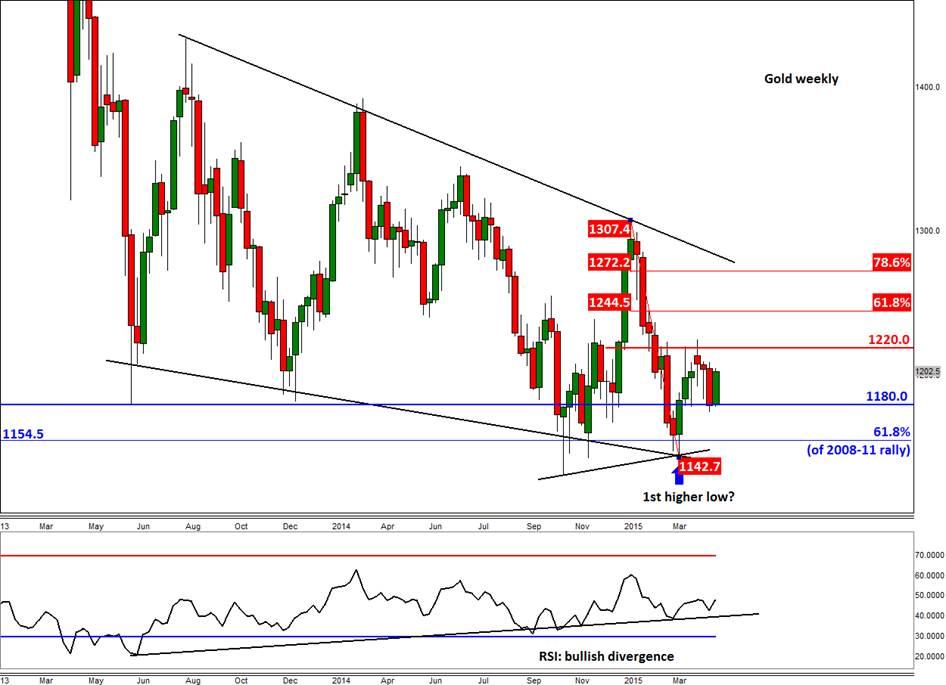
But as the weekly chart shows in figure 2, gold may be in the process of forming a major bottom. Not only has the selling pressure of the past several years come to a halt around the key 61.8% Fibonacci retracement level of the 2008-2011 rally, gold may have already formed a higher low when it found a base at $1142 in January. That particular low was a touch higher than the one created in November at just above $1131. What’s more, the momentum indicator RSI is showing a bullish divergence with price: it has created several instances of higher lows even though the underlying gold price made lower lows. This suggests that the bearish momentum is dwindling.


Recommended Content
Editors’ Picks
EUR/USD clings to daily gains above 1.0650

EUR/USD gained traction and turned positive on the day above 1.0650. The improvement seen in risk mood following the earlier flight to safety weighs on the US Dollar ahead of the weekend and helps the pair push higher.
GBP/USD recovers toward 1.2450 after UK Retail Sales data

GBP/USD reversed its direction and advanced to the 1.2450 area after touching a fresh multi-month low below 1.2400 in the Asian session. The positive shift seen in risk mood on easing fears over a deepening Iran-Israel conflict supports the pair.
Gold holds steady at around $2,380 following earlier spike

Gold stabilized near $2,380 after spiking above $2,400 with the immediate reaction to reports of Israel striking Iran. Meanwhile, the pullback seen in the US Treasury bond yields helps XAU/USD hold its ground.
Bitcoin Weekly Forecast: BTC post-halving rally could be partially priced in Premium

Bitcoin price shows no signs of directional bias while it holds above $60,000. The fourth BTC halving is partially priced in, according to Deutsche Bank’s research.
Week ahead – US GDP and BoJ decision on top of next week’s agenda

US GDP, core PCE and PMIs the next tests for the Dollar. Investors await BoJ for guidance about next rate hike. EU and UK PMIs, as well as Australian CPIs also on tap.