![]()
As my colleague Fawad Razaqzada noted earlier today, the FTSE and other European stock indices are stabilizing today after yesterday’s collapse on the back of weak US Manufacturing data and profit-taking ahead of high-impact economic data. US markets also started the month of October off on the wrong foot, with the Dow Jones Industrial Average falling 238 points yesterday, while the S&P 500 shed 26 points.
After yesterday’s harrowing drop global stock markets, traders the world over are wondering whether the long-awaited correction is underway. Rather than making rash emotional decisions, we wanted to look take an objective look at the health of the prolonged uptrend off the 2011 low.
In a sideways market, technical traders often look at the price relative to static support or resistance areas to determine whether the instrument is breaking out. This same principle can be adapted to evaluate whether a longer-term trend is breaking by looking at the price relative to a dynamic level of support or resistance, like a moving average.
Readers can easily modify the widely used Moving Average Convergence-Divergence (MACD) indicator to display this information by changing the settings for the first period to 1 and the second period to their preferred MA length (ignore the signal line). These parameters tell the trading software to calculate the difference between the “1-period moving average†(the current price) and the XX-period moving average. When this difference breaks out of an established range, it can be a warning sign that the established trend may be coming to an end.
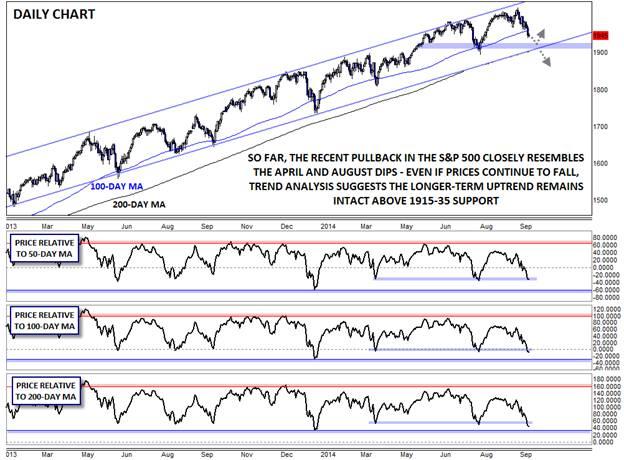
Below, we apply this tool to the S&P 500 by comparing the current price to the 50-, 100-, and 200-day moving averages. Taking the first indicator pane (“Price Relative to 50-day MAâ€), we can see that the widely-followed US index remains well within its recent range relative the 50-day moving average. In fact, the last pullback in early August took the market about 35 points below its 50-day MA, relative to the current 25 points below. The other panes show a similar picture, with the index a few points below its 100-day MA and still about 50 points above its 200-day MA, in-line with the previous two pullbacks this year.
The upshot of this analysis is that, so far, the recent pullback closely resembles the dips that we saw in April and August. If the S&P 500 finds support and starts to rally into the close of this week, this analysis suggests that the current level may represent a favorable level to join the established uptrend.
Even if prices do continue to fall from here, the longer-term bullish trend will remain intact as long as the three relative MAs remain above their February lows. In this case, those levels are about 60 points below the 50-day MA, 30 points below the 100-day MA, and 35 points above the 200-day MA. In other words, only a drop below strong support in the 1915-1935 zone would suggest that the “character†of the established uptrend has changed.
Until then, the bullish trend remains a friend to US equities.
This research is for informational purposes and should not be construed as personal advice. Trading any financial market involves risk. Trading on leverage involves risk of losses greater than deposits.
Recommended Content
Editors’ Picks
EUR/USD clings to daily gains above 1.0650

EUR/USD gained traction and turned positive on the day above 1.0650. The improvement seen in risk mood following the earlier flight to safety weighs on the US Dollar ahead of the weekend and helps the pair push higher.
GBP/USD recovers toward 1.2450 after UK Retail Sales data

GBP/USD reversed its direction and advanced to the 1.2450 area after touching a fresh multi-month low below 1.2400 in the Asian session. The positive shift seen in risk mood on easing fears over a deepening Iran-Israel conflict supports the pair.
Gold holds steady at around $2,380 following earlier spike

Gold stabilized near $2,380 after spiking above $2,400 with the immediate reaction to reports of Israel striking Iran. Meanwhile, the pullback seen in the US Treasury bond yields helps XAU/USD hold its ground.
Bitcoin Weekly Forecast: BTC post-halving rally could be partially priced in Premium

Bitcoin price shows no signs of directional bias while it holds above $60,000. The fourth BTC halving is partially priced in, according to Deutsche Bank’s research.
Week ahead – US GDP and BoJ decision on top of next week’s agenda

US GDP, core PCE and PMIs the next tests for the Dollar. Investors await BoJ for guidance about next rate hike. EU and UK PMIs, as well as Australian CPIs also on tap.
