![]()
Beyond extreme Halloween enthusiasts, AUDUSD bulls are probably more excited than anyone to turn the calendar page over to October. The month of September did not treat the Aussie well at all, with the currency falling nearly 600 pips over the course of the month, though some traders are starting to wonder whether September’s swoon may have reached excessive levels.
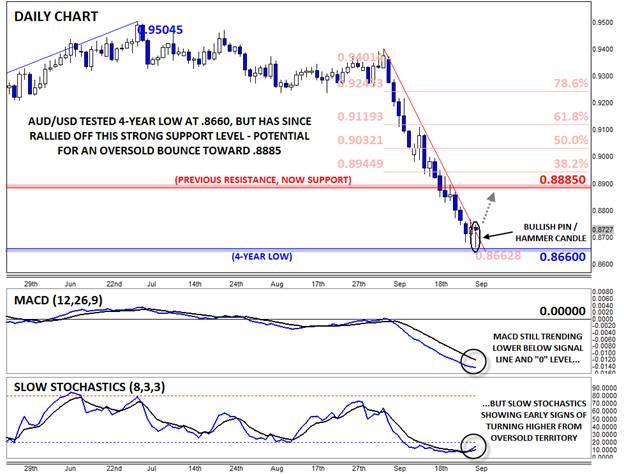
Unfortunately, October started off on the wrong foot from a fundamental perspective. As my colleague Chris Tedder outlined earlier today, both Australian retail sales and housing data came out below expectations in today’s Asian session. These weak economic reports pushed AUDUSD to within 5 pips of its four-year low at .8660, but buyers stepped in aggressively to defend this key floor. Rates have now bounced 90 pips off the intraday low and have nearly turned positive on the week.
As we often note in these reports, one of the most reliable signals in the market is when price action and news diverge; in this case, the bearish economic data has not led to a commensurate bearish move in the exchange rate. These types of reactions are often seen at “exhaustion points” the mark a potential end to an extended trend.
From a more traditional technical perspective, today’s price action is currently showing a Bullish Pin Candle*, or hammer formation, on the daily chart. This candlestick pattern shows a shift from selling to buying pressure and is often seen at near-term lows in the market. Meanwhile, rates are also peeking above the bearish trend line that guided prices lower throughout all off September’s selloff.
The secondary indicators are painting a mixed picture. Not surprisingly, the MACD continues to trend lower below its signal line and “0” level, showing established bearish momentum. However, the more sensitive Slow Stochastics indicator is showing signs of turning higher from oversold territory, suggesting that the selling pressure is starting to wane.
Despite these potentially bullish signs, more conservative traders may want to wait for a confirmed break of the trend line before turning remotely bullish. If we do see a rally through the trend line, a more substantial bounce toward previous-support-turned-resistance at .8885 or the 38.2% Fibonacci retracement of September’s drop at .8945 may be seen. Meanwhile, a break of the 4-year low at .8660 would herald another leg lower in the pair, potentially toward the longer-term Fib retracement at .8540 (not shown) in time.
*A Bullish Pin (Pinnochio) candle, also known as a hammer or paper umbrella, is formed when prices fall within the candle before buyers step in and push prices back up to close near the open. It suggests the potential for a bullish continuation if the high of the candle is broken.
Source: FOREX.com
General Risk Warning for stocks, cryptocurrencies, ETP, FX & CFD Trading. Investment assets are leveraged products. Trading related to foreign exchange, commodities, financial indices, stocks, ETP, cryptocurrencies, and other underlying variables carry a high level of risk and can result in the loss of all of your investment. As such, variable investments may not be appropriate for all investors. You should not invest money that you cannot afford to lose. Before deciding to trade, you should become aware of all the risks associated with trading, and seek advice from an independent and suitably licensed financial advisor. Under no circumstances shall Witbrew LLC and associates have any liability to any person or entity for (a) any loss or damage in whole or part caused by, resulting from, or relating to any transactions related to investment trading or (b) any direct, indirect, special, consequential or incidental damages whatsoever.
Recommended Content
Editors’ Picks
AUD/USD posts gain, yet dive below 0.6500 amid Aussie CPI, ahead of US GDP

The Aussie Dollar finished Wednesday’s session with decent gains of 0.15% against the US Dollar, yet it retreated from weekly highs of 0.6529, which it hit after a hotter-than-expected inflation report. As the Asian session begins, the AUD/USD trades around 0.6495.
USD/JPY finds its highest bids since 1990, approaches 156.00

USD/JPY broke into its highest chart territory since June of 1990 on Wednesday, peaking near 155.40 for the first time in 34 years as the Japanese Yen continues to tumble across the broad FX market.
Gold stays firm amid higher US yields as traders await US GDP data

Gold recovers from recent losses, buoyed by market interest despite a stronger US Dollar and higher US Treasury yields. De-escalation of Middle East tensions contributed to increased market stability, denting the appetite for Gold buying.
Ethereum suffers slight pullback, Hong Kong spot ETH ETFs to begin trading on April 30

Ethereum suffered a brief decline on Wednesday afternoon despite increased accumulation from whales. This follows Ethereum restaking protocol Renzo restaked ETH crashing from its 1:1 peg with ETH and increased activities surrounding spot Ethereum ETFs.
Dow Jones Industrial Average hesitates on Wednesday as markets wait for key US data

The DJIA stumbled on Wednesday, falling from recent highs near 38,550.00 as investors ease off of Tuesday’s risk appetite. The index recovered as US data continues to vex financial markets that remain overwhelmingly focused on rate cuts from the US Fed.
