![]()
What a volatile few days it has been for the FTSE! At end of last week, the UK index staged a relief rally as the market priced in and then reacted to news of a No vote for Scottish independence. That rally quickly came to a halt on Friday at around the key 6890/6900 resistance area, leading to an equally sharp pullback that continued into today’s session. The selling was exacerbated by the fact it has been a quiet day in terms of data releases. The only notable exception was the release of US existing home sales for the month of August. This however disappointed as it unexpectedly fell 1.8% over the month. News of Tesco didn’t help the UK market either. The struggling supermarket announced that it had overstated its half-year profit guidance by £250 million. Though the company took swift action to suspend several of its executives, including the UK managing director Chris Bush, it was not enough to help its share price with the stock closing the day down more than 11%. The trend could become clearer for the FTSE on Tuesday, as there are lots of manufacturing and services PMIs to provide direction. The Chinese manufacturing PMI comes in at 2:45 BST followed by the Eurozone data between 8 to 9am.
Technical view
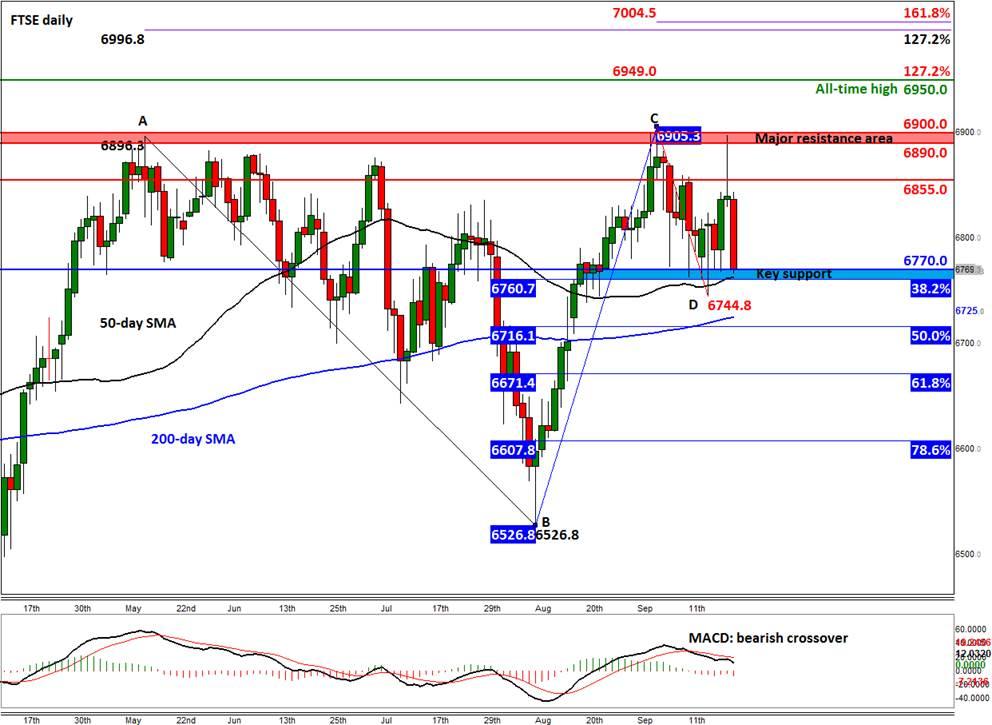
The resulting price action of the last few days, including Friday when the index formed a shooting star candle, has led to the formation of a three candle reversal pattern. While this is a bearish pattern, it is important to note however that it does not necessarily suggest a complete reversal in trend; it could merely be a change or pause in direction. A key support area around 6760/70 is now being tested. This is where the 50-day SMA meets the prior lows and the 38.2% Fibonacci retracement of the upswing from the August low (i.e. the BC rally). The FTSE needs to hold above here otherwise the short-term bullish trend could come to an end. The next support level is the 200-day SMA at 6725, followed by the 61.8% Fibonacci level at 6670.
But with the US markets still near record highs and a major source of uncertainty i.e. Scottish independence fears over the UK markets now lifted, this may be the time for the FTSE to finally break through the 6900 barrier and climb towards and beyond the all-time high of 6950 that was achieved in 1999. To get there, the index will have to break above several resistance levels including 6855 and also post a daily close above 6900. Once these targets are achieved, the 6950 mark would be the first logical target, for it also corresponds with the 127.2% Fibonacci extension level of the most recent correction (i.e. from point C to D on the daily chart).
Figure 1:
Source: FOREX.com. Please note this product is not available to US clients.
General Risk Warning for stocks, cryptocurrencies, ETP, FX & CFD Trading. Investment assets are leveraged products. Trading related to foreign exchange, commodities, financial indices, stocks, ETP, cryptocurrencies, and other underlying variables carry a high level of risk and can result in the loss of all of your investment. As such, variable investments may not be appropriate for all investors. You should not invest money that you cannot afford to lose. Before deciding to trade, you should become aware of all the risks associated with trading, and seek advice from an independent and suitably licensed financial advisor. Under no circumstances shall Witbrew LLC and associates have any liability to any person or entity for (a) any loss or damage in whole or part caused by, resulting from, or relating to any transactions related to investment trading or (b) any direct, indirect, special, consequential or incidental damages whatsoever.
Recommended Content
Editors’ Picks
AUD/USD keeps the red below 0.6400 as Middle East war fears mount

AUD/USD is keeping heavy losses below 0.6400, as risk-aversion persists following the news that Israel retaliated with missile strikes on a site in Iran. Fears of the Israel-Iran strife translating into a wider regional conflict are weighing on the higher-yielding Aussie Dollar.
USD/JPY recovers above 154.00 despite Israel-Iran escalation

USD/JPY is recovering ground above 154.00 after falling hard on confirmation of reports of an Israeli missile strike on Iran, implying that an open conflict is underway and could only spread into a wider Middle East war. Safe-haven Japanese Yen jumped, helped by BoJ Governor Ueda's comments.
Gold price pares gains below $2,400, geopolitical risks lend support

Gold price is paring gains to trade back below $2,400 early Friday, Iran's downplaying of Israel's attack has paused the Gold price rally but the upside remains supported amid mounting fears over a potential wider Middle East regional conflict.
WTI surges to $85.00 amid Israel-Iran tensions

Western Texas Intermediate, the US crude oil benchmark, is trading around $85.00 on Friday. The black gold gains traction on the day amid the escalating tension between Israel and Iran after a US official confirmed that Israeli missiles had hit a site in Iran.
Dogwifhat price pumps 5% ahead of possible Coinbase effect

Dogwifhat price recorded an uptick on Thursday, going as far as to outperform its peers in the meme coins space. Second only to Bonk Inu, WIF token’s show of strength was not just influenced by Bitcoin price reclaiming above $63,000.
