![]()
In a sideways market, technical traders often look at the price relative to static support or resistance areas to determine whether the instrument is breaking out. This same principle can be adapted to evaluate whether a longer-term trend is breaking by looking at the price relative to a dynamic level of support or resistance, like a moving average.
Readers can easily modify the widely used Moving Average Convergence-Divergence (MACD) indicator to display this information by changing the settings for the first period to 1 and the second period to their preferred MA length (ignore the signal line). These parameters tell the trading software to calculate the difference between the “1-period moving average” (the current price) and the XX-period moving average. When this difference breaks out of an established range, it can be a warning sign that the established trend may be coming to an end.
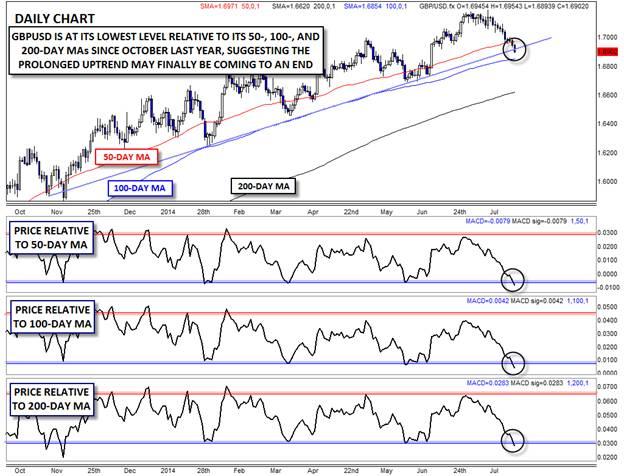
Below, we apply this tool to the GBPUSD by comparing price to the 50-, 100-, and 200-day moving averages. Taking the first indicator pane (“Price Relative to 50-day MA”), we can see that since the current uptrend began back in October, price has oscillated between rising up to about 300 pips above the 50-day MA and about 50 pips below it. As of writing, the GBPUSD is trading about 80 pips below the 50-day MA, its lowest level relative to that indicator in a year.
The picture is nearly identical when looking at price relative to two other widely-followed MAs. Price is currently only 43 pips above the 100-day MA, whereas price consistently found support about 75 pips above it on previous dips within the uptrend. Similarly, the current price is just 280 pips above the 200-day MA, vs. previous troughs in the 300 area. Just like when a currency pair breaks out of a horizontal range, the drop below indicator support suggests we could see a strong continuation to the downside, or price dropping substantially below the relevant moving averages.
While GBPUSD bulls could still step in and push rates back higher later this week, the pair has seen more technical damage on this drop than any time since the uptrend began eight months ago. Therefore, bullish traders may want to treat the current uptrend with skepticism, even though the series of higher highs and higher lows is still intact.
Source: FOREX.com
General Risk Warning for stocks, cryptocurrencies, ETP, FX & CFD Trading. Investment assets are leveraged products. Trading related to foreign exchange, commodities, financial indices, stocks, ETP, cryptocurrencies, and other underlying variables carry a high level of risk and can result in the loss of all of your investment. As such, variable investments may not be appropriate for all investors. You should not invest money that you cannot afford to lose. Before deciding to trade, you should become aware of all the risks associated with trading, and seek advice from an independent and suitably licensed financial advisor. Under no circumstances shall Witbrew LLC and associates have any liability to any person or entity for (a) any loss or damage in whole or part caused by, resulting from, or relating to any transactions related to investment trading or (b) any direct, indirect, special, consequential or incidental damages whatsoever.
Recommended Content
Editors’ Picks
EUR/USD stays near 1.0700 after US data

EUR/USD stays in a consolidation phase at around 1.0700 in the early American session on Wednesday. The data from the US showed a strong increase in Durable Goods Orders but failed to provide a boost to the US Dollar.
USD/JPY refreshes 34-year high, attacks 155.00 as intervention risks loom

USD/JPY is renewing a multi-decade high, closing in on 155.00. Traders turn cautious on heightened risks of Japan's FX intervention. Broad US Dollar rebound aids the upside in the major. US Durable Goods data are next on tap.
Gold manages to hold above $2,300

Gold struggles to stage a rebound following Monday's sharp decline but manages to hold above $2,300. The benchmark 10-year US Treasury bond yield stays in the green above 4.6% ahead of US data, not allowing XAU/USD to gain traction.
Worldcoin looks set for comeback despite Nvidia’s 22% crash Premium

Worldcoin price is in a better position than last week's and shows signs of a potential comeback. This development occurs amid the sharp decline in the valuation of the popular GPU manufacturer Nvidia.
Three fundamentals for the week: US GDP, BoJ and the Fed's favorite inflation gauge stand out Premium

While it is hard to predict when geopolitical news erupts, the level of tension is lower – allowing for key data to have its say. This week's US figures are set to shape the Federal Reserve's decision next week – and the Bank of Japan may struggle to halt the Yen's deterioration.
