![]()
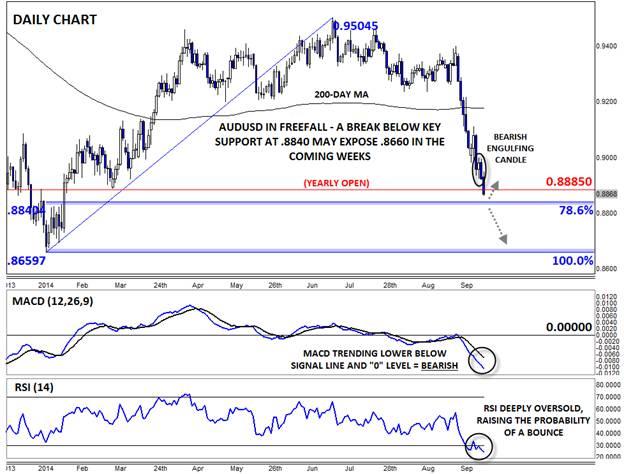
It’s been another quiet start to the trading week, with by far the most interesting move developing in the AUDUSD. Just two weeks ago, we highlighted the big Head-and-Shoulders pattern on the pair, concluding that, “…bears may eventually look to target the 61.8% retracement of the H1 rally at .8980 or the measured move target projection of the H&S pattern at .8950†as a result of the pattern (see “AUDUSD on the Verge of a Major Breakdown – Could .8950 Be Next?†for more). Since that post, the pair has collapsed over 300 pips, reaching both of the targets outlined two weeks ago, but the current fundamental and technical developments suggest the pair could see more downside before finding a floor.
From a fundamental perspective, AUDUSD bulls have been hit from both sides. The US dollar has continued to rally, with the widely-followed USD index now closing higher for 10(!) consecutive weeks, its longest streak since President Richard Nixon officially put an end to the gold standard all the way back in 1973. The latest bullish catalyst for the greenback was this weekend’s decision by ratings agency Fitch to reaffirm the United States’ creditworthiness at AAA, its top rating.
Meanwhile, the Australian dollar has been beaten down by its own idiosyncratic developments. The export-dependent currency has been particularly hard hit by the recent decline in commodity prices; the popular Reuters/Jefferies CRB index of commodities has fallen nearly 10% from its June high, hurting Australia’s terms of trade. More immediately, traders are also growing uneasy about tonight’s Chinese HSBC Manufacturing reading, which may fall back below the 50 boom-bust level for the first time since May.
Technical View: AUDUSD
Unfortunately, the chart is not offering any solace to AUDUSD bulls either. The pair put in a clear Bearish Engulfing Candle* on Friday, suggesting that the sellers eager to sell on any short-term bounces. From a wider perspective, rates just dropped below the 2014 open at .8885 a few hours ago, meaning that the Aussie is now trading down against the greenback in 2014.
The secondary indicators are suggesting about you’d expect after such a large drop: the MACD shows strongly bearish momentum, though the RSI is deeply oversold. As a reminder, oversold RSI readings are not necessarily an immediate signal for a bounce; it is generally considered prudent for traders to wait for a bullish candlestick pattern or strong level of support before picking a bottom.
Moving forward, the sellers clearly remain in control of AUDUSD. The next level of support to watch for a possible bounce is the 78.6% Fibonacci retracement at .8840, but if that floor is broken, the Aussie could drop all the way to the yearly low at .8660 before buyers emerge.
*A Bearish Engulfing candle is formed when the candle breaks above the high of the previous time period before sellers step in and push rates down to close below the low of the previous time period. It indicates that the sellers have wrested control of the market from the buyers.
This research is for informational purposes and should not be construed as personal advice. Trading any financial market involves risk. Trading on leverage involves risk of losses greater than deposits.
Recommended Content
Editors’ Picks
AUD/USD failed just ahead of the 200-day SMA

Finally, AUD/USD managed to break above the 0.6500 barrier on Wednesday, extending the weekly recovery, although its advance faltered just ahead of the 0.6530 region, where the key 200-day SMA sits.
EUR/USD met some decent resistance above 1.0700

EUR/USD remained unable to gather extra upside traction and surpass the 1.0700 hurdle in a convincing fashion on Wednesday, instead giving away part of the weekly gains against the backdrop of a decent bounce in the Dollar.
Gold keeps consolidating ahead of US first-tier figures

Gold finds it difficult to stage a rebound midweek following Monday's sharp decline but manages to hold above $2,300. The benchmark 10-year US Treasury bond yield stays in the green above 4.6% after US data, not allowing the pair to turn north.
Bitcoin price could be primed for correction as bearish activity grows near $66K area

Bitcoin (BTC) price managed to maintain a northbound trajectory after the April 20 halving, despite bold assertions by analysts that the event would be a “sell the news” situation. However, after four days of strength, the tables could be turning as a dark cloud now hovers above BTC price.
Bank of Japan's predicament: The BOJ is trapped

In this special edition of TradeGATEHub Live Trading, we're joined by guest speaker Tavi @TaviCosta, who shares his insights on the Bank of Japan's current predicament, stating, 'The BOJ is Trapped.'
