![]()
One of our persistent biases last week was that the US Dollar rally was due for a breather after strengthening dramatically over the previous few weeks. That theme played out nicely in some markets (USDJPY, USDCAD, AUDUSD, Gold and Oil), but failed to develop in other markets (EURUSD and USDCHF). Regardless, the scene may now be set for another leg higher in the greenback across the board, assuming this week’s high-impact US data cooperates.
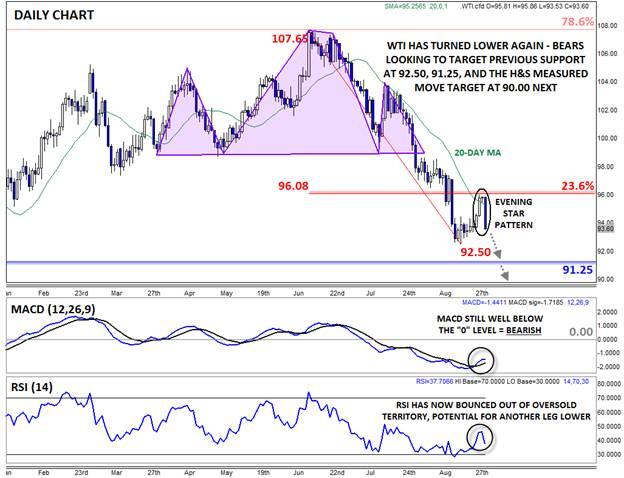
One of the most actionable setups at this point could be in WTI, which is in freefall today after bouncing back to 96.00 last week. As we noted two weeks ago, a multi-month Head-and-Shoulders pattern suggests that the commodity could still see further downside toward 90.00 over the medium-term (see “WTI: Could Oil Hit its H&S Target at 90.00?” for more). More immediately, prices are putting the finishing touches on a clear Evening Star candlestick pattern; this relatively rare 3-candle reversal pattern shows a shift from buying to selling pressure and is often seen at near-term tops in the market.
Beyond the price itself, the other technical indicators are also painting a bearish picture. Last week’s bounce stalled out directly at the shallow 23.6% Fibonacci retracement and the downward-sloping 20-day MA, which has consistently put a cap on oil over the last two months. Meanwhile, the MACD remains well below the “0” level, showing generally bearish momentum, while the RSI has bounced out of oversold territory, potentially opening the door for another leg lower from here.
To the downside, bears may look to take the pair back to the August lows at 92.50 next. If bears can maintain the upper hand, the 16-month low at 91.25 and the H&S measured move target near 90.00 could come into play later this month. On the other hand, bulls likely want to see if WTI can regain its 20-day MA and the 96.00 handle before committing to medium-term buy trades.
* An Evening Star candle formation is relatively rare candlestick formation created by a long green candle, followed a small-bodied candle near the top of the first candle, and completed by a long-bodied red candle. It represents a transition from bullish to bearish momentum and foreshadows more weakness to come.
Source: FOREX.com
General Risk Warning for stocks, cryptocurrencies, ETP, FX & CFD Trading. Investment assets are leveraged products. Trading related to foreign exchange, commodities, financial indices, stocks, ETP, cryptocurrencies, and other underlying variables carry a high level of risk and can result in the loss of all of your investment. As such, variable investments may not be appropriate for all investors. You should not invest money that you cannot afford to lose. Before deciding to trade, you should become aware of all the risks associated with trading, and seek advice from an independent and suitably licensed financial advisor. Under no circumstances shall Witbrew LLC and associates have any liability to any person or entity for (a) any loss or damage in whole or part caused by, resulting from, or relating to any transactions related to investment trading or (b) any direct, indirect, special, consequential or incidental damages whatsoever.
Recommended Content
Editors’ Picks
US economy grows at an annual rate of 1.6% in Q1 – LIVE

The US' real GDP expanded at an annual rate of 1.6% in the first quarter, the US Bureau of Economic Analysis' first estimate showed on Thursday. This reading came in worse than the market expectation for a growth of 2.5%.
EUR/USD retreats below 1.0700 after US GDP data

EUR/USD came under modest bearish pressure and retreated below 1.0700. Although the US data showed that the economy grew at a softer pace than expected in Q1, strong inflation-related details provided a boost to the USD.
GBP/USD declines below 1.2500 with first reaction to US data

GBP/USD declined below 1.2500 and erased a portion of its daily gains with the immediate reaction to the US GDP report. The US economy expanded at a softer pace than expected in Q1 but the price deflator jumped to 3.4% from 1.8%.
Gold falls below $2,330 as US yields push higher

Gold came under modest bearish pressure and declined below $2,330. The benchmark 10-year US Treasury bond yield is up more than 1% on the day after US GDP report, making it difficult for XAU/USD to extend its daily recovery.
XRP extends its decline, crypto experts comment on Ripple stablecoin and benefits for XRP Ledger

Ripple extends decline to $0.52 on Thursday, wipes out weekly gains. Crypto expert asks Ripple CTO how the stablecoin will benefit the XRP Ledger and native token XRP.
