![]()
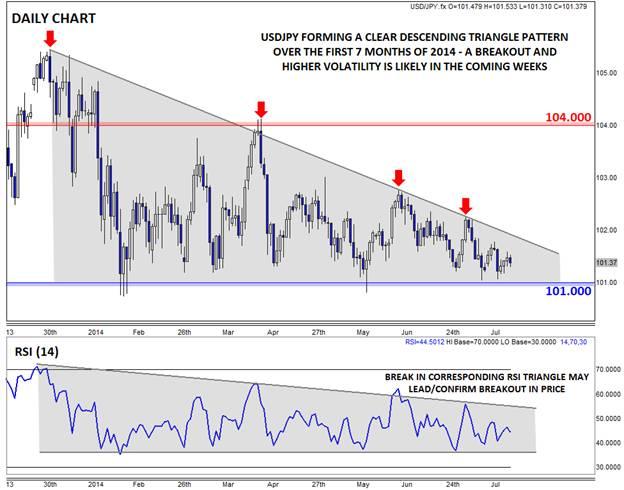
Out of all the major currency pairs, the USDJPY has undoubtedly been one of the dullest thus far this year. The pair has been trapped within a tight range from roughly 101.00 to 104.00 since mid-January, driving the average weekly range (ATR) to levels not seen since before the introduction of Abenomics in Q3 2012. Just when traders thought it couldn’t get any worse, bears began stepping in at lower and lower levels, and starting in Q2 of this year, the unit has been trapped within a tighter range from 101.00 to 102.70.
On the bright side for USDJPY traders, volatility tends to be cyclical, so periods of high volatility often follow periods of subdued price movement. Traders have gone from excitement with the pair’s volatility, to patiently waiting for a breakout, to outright apathy and disgust with the low volatility as we go to press. While we can appreciate readers’ skepticism, the historically low volatility suggests we could see a breakout and more volatility in the near future.
As we noted above, there are growing signs that the bears may be gaining the upper hand. Rates have now put in four major lower highs since the New Year’s Day peak above 105.00. With strong support still emerging around 101.00, the price action over the first seven months of the year has created the textbook descending triangle pattern. In general, these patterns show growing selling pressure and typically break to the downside, but prudent traders may prefer to wait for a confirmed breakout before trading off the pattern.
In a similar vein, USDJPY’s daily RSI has formed its own corresponding descending triangle pattern with support at the 36 level. A break in the indicator’s pattern could serve as a valuable leading (or at least confirming) signal for a break in price itself.
If we do see a downside breakout in the next week or two, bears will look to target key psychological support at 100.00 next, followed by the 50% Fibonacci retracement of the H2 2013 rally at 99.60 (not shown). Alternatively, a bullish breakout above the descending trend line could expose the 3-month high around 102.70, or even the top of the 6-month range at 104.00 next.
Source: FOREX.com
General Risk Warning for stocks, cryptocurrencies, ETP, FX & CFD Trading. Investment assets are leveraged products. Trading related to foreign exchange, commodities, financial indices, stocks, ETP, cryptocurrencies, and other underlying variables carry a high level of risk and can result in the loss of all of your investment. As such, variable investments may not be appropriate for all investors. You should not invest money that you cannot afford to lose. Before deciding to trade, you should become aware of all the risks associated with trading, and seek advice from an independent and suitably licensed financial advisor. Under no circumstances shall Witbrew LLC and associates have any liability to any person or entity for (a) any loss or damage in whole or part caused by, resulting from, or relating to any transactions related to investment trading or (b) any direct, indirect, special, consequential or incidental damages whatsoever.
Recommended Content
Editors’ Picks
EUR/USD steadies above 1.0600, awaits German ZEW and Powell speech

EUR/USD is holding above 1.0600 in the European morning on Tuesday, having hit fresh five-month lows. The pair draws support from sluggish US Treasury bond yields but the rebound appears capped amid a stronger US Dollar and risk-aversion. Germany's ZEW survey and Powell awaited.
GBP/USD stays below 1.2450 after UK employment data

GBP/USD trades marginally lower on the day below 1.2450 in the early European session on Tuesday. The data from the UK showed that the ILO Unemployment Rate in February rose to 4.2% from 4%, weighing on Pound Sterling.
Will Gold reclaim $2,400 ahead of Powell speech?

Gold price consolidates the rebound below $2,400 amid risk-aversion. Dollar gains on strong US Retail Sales data despite easing Middle East tensions. Bullish potential for Gold price still intact on favorable four-hour technical setup.
SOL primed for a breakout as it completes a rounding bottom pattern

Solana price has conformed to the broader market crash, following in the steps of Bitcoin price that remains in the red below the $65,000 threshold. For SOL, however, the sensational altcoin could have a big move in store.
Canada CPI Preview: Inflation expected to accelerate in March, snapping two-month downtrend

The Canadian Consumer Price Index is seen gathering some upside traction in March. The BoC deems risks to the inflation outlook to be balanced. The Canadian Dollar navigates five-month lows against the US Dollar.
