![]()
This could be a big week for developed world stock markets. Not only are 10% of the S&P 500 reporting earnings for Q1 in the next few days, but we also have some technical factors worth watching. Will stocks continue to decline, or can they bounce higher from here?
Earnings:
While only 28 of the 500 companies in the S&P have reported earnings so far, the results have been less than inspiring and are setting a worrying precedent for investors. While earnings have generally been stronger, the sales side of the equation is weak, with 40% of the first 28 firms to report missing sales estimates. Weak sales growth is nothing new, but now that the market appears to believe that valuations are looking rich, investors are starting to take notice. If companies can’t beat sales expectations in an environment of low interest rates, when can they? Johnson &Johnson, Coca-Cola, Bank of America and Google are some of the blue-chip highlights to watch out for this week. If they follow JP Morgan and disappoint expectations we could see further downside in the markets as we approach this week’s holidays.
Lead indicators:
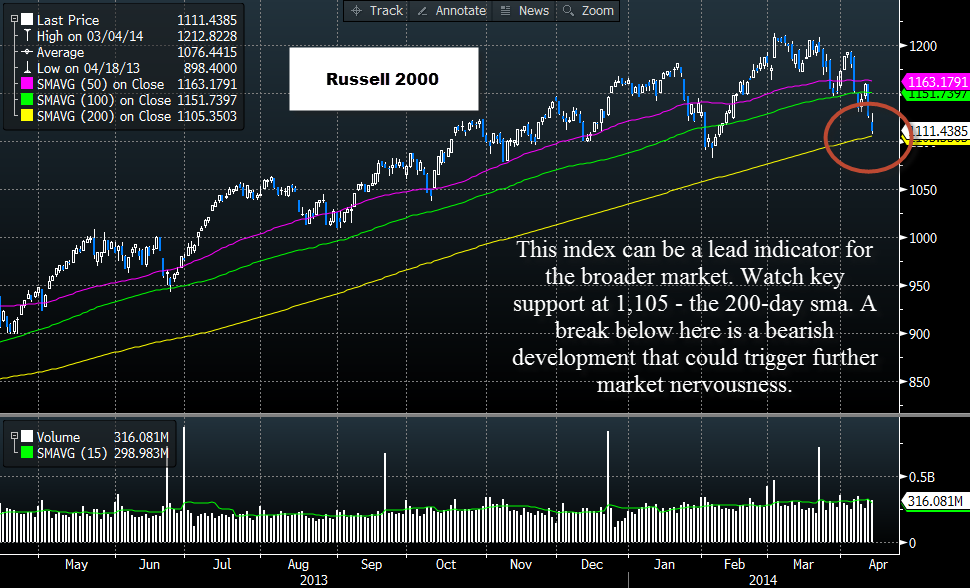
Some stock market theories look closely at lead indicators – think Dow Theory. Right now lead indicators are approaching some key levels on the downside. For US markets, key lead indicators include the Russell 2000 (a small-cap index) and the Dow Jones Transports index. Looking at the Russell first, it has fallen more than 8% since peaking in March and is testing a critical support level, the 200-day sma at 1,105. If we fall below here it would be a very bearish development and could weigh on the broader market. The Transport index has not been as heavily sold as the Russell 2000; however it is down some 4% since peaking earlier this month and is also testing a key support zone, the 50% Fib retracement of the Feb low to April high at 7,360. If we breach these key support levels then we could see further declines in the broader market.
Valuations:
Below are the current price-to-earnings ratios of the major US indices:
Dow Jones: 15.07
Dow Jones Transports: 19.70
S&P 500: 16.75
Nasdaq: 20.40
Although much has been said about valuations being too high, we are not at historically stretched levels. The Nasdaq’s current reading of just over 20 is a third less than it was in 2005. They are also nowhere near the peak reached in 2001, during the dotcom bubble. This does not mean that the market has “got it wrong†and stocks should not sell off. Of course, not all sell-offs have to be like 1929, 2001 or 2008, instead it may suggest that the pullback may not be as aggressive if the market valuations are less stretched. Also, US economic data is rebounding after a torrid start to the year. The pick-up in April consumer confidence is also worth noting, since this can be positively correlated to the S&P 500.
Conclusions:
The short term direction of stocks may be dependent on the strength of earnings season. The market will look for better than expected sales growth, since profit growth on the back of cost-cutting isn’t the type of growth markets are willing to tolerate in this environment. It will be interesting to see if the markets give the corporates the benefit of the doubt if they blame poor performance on the bad weather earlier this year; I have a feeling the markets may not be in a generous mood right now.
Valuations are not as stretched as they have been historically, but that doesn’t mean a sell-off is not deserved, even though it could be mild compared with the 2008 sell-off.
The next 24-48 hours are critical. Watch the Russell index closely. It is considered a lead indicator for market sentiment. If it shoots below its 200-day sma then we could see further declines in the broader US large-cap indices.
We mentioned on Friday that the pick-up in US consumer confidence could bode well for stocks, see more HERE. If we continue to see economic data pick up this week, and if this relationship holds, the sell-off could be short-lived.

CFD’s, Options and Forex are leveraged products which can result in losses that exceed your initial deposit. These products may not be suitable for all investors and you should seek independent advice if necessary.
Recommended Content
Editors’ Picks
EUR/USD clings to daily gains above 1.0650

EUR/USD gained traction and turned positive on the day above 1.0650. The improvement seen in risk mood following the earlier flight to safety weighs on the US Dollar ahead of the weekend and helps the pair push higher.
GBP/USD recovers toward 1.2450 after UK Retail Sales data

GBP/USD reversed its direction and advanced to the 1.2450 area after touching a fresh multi-month low below 1.2400 in the Asian session. The positive shift seen in risk mood on easing fears over a deepening Iran-Israel conflict supports the pair.
Gold holds steady at around $2,380 following earlier spike

Gold stabilized near $2,380 after spiking above $2,400 with the immediate reaction to reports of Israel striking Iran. Meanwhile, the pullback seen in the US Treasury bond yields helps XAU/USD hold its ground.
Bitcoin Weekly Forecast: BTC post-halving rally could be partially priced in Premium

Bitcoin price shows no signs of directional bias while it holds above $60,000. The fourth BTC halving is partially priced in, according to Deutsche Bank’s research.
Week ahead – US GDP and BoJ decision on top of next week’s agenda

US GDP, core PCE and PMIs the next tests for the Dollar. Investors await BoJ for guidance about next rate hike. EU and UK PMIs, as well as Australian CPIs also on tap.