
Written by: Joseph Trevisani, Chief Market Strategist at WorldWideMarkets
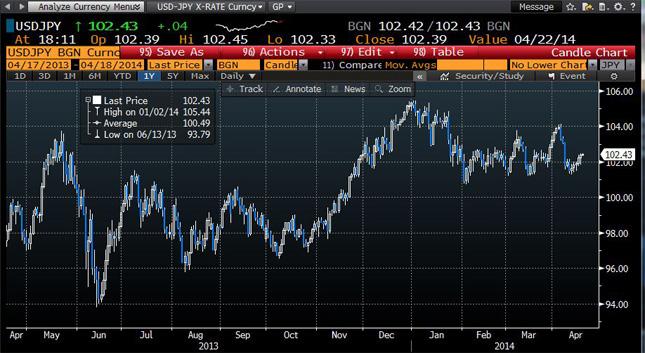
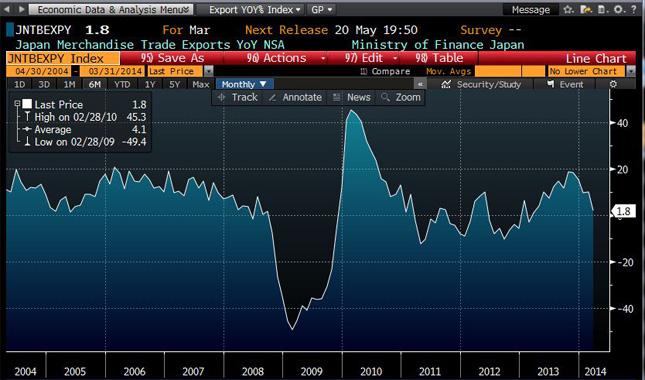
Europe is in the doldrums. Despite Mario Draghi’s brave words and Germany aside, ECB monetary policy is not going to revive economic growth in the currency union. Japan has staked her future on the manipulations of Abenomics, but the hopes brought by a falling yen have dissipated as exports and other key indicators have faltered.
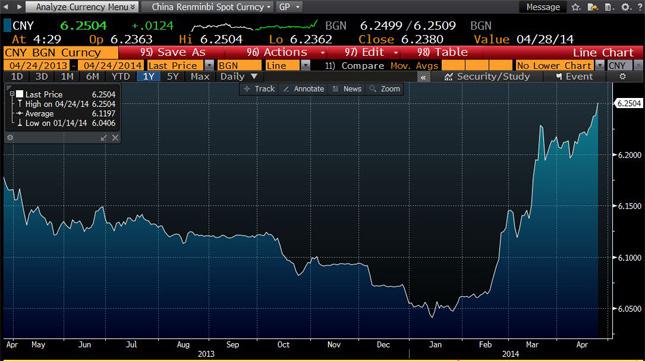
China is an enigma. The mainland economy is buffeted by a government drive to rein in credit, over-extended housing and manufacturing sectors and reported by doubtful statistics. The clearest sign of serious trouble is the sudden devaluation of the Yuan, which has fallen 3.5 percent against the dollar since mid-January in a deliberate attempt by the Beijing government to bolster Chinese exports.
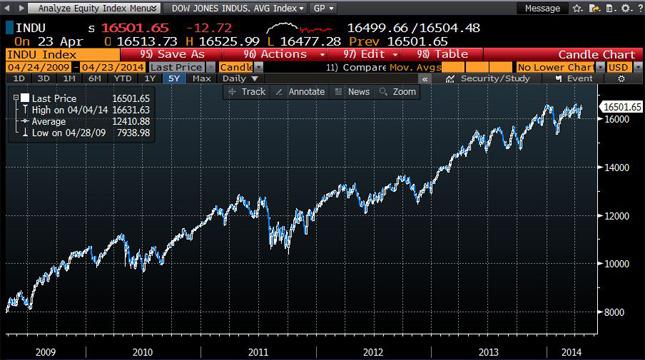
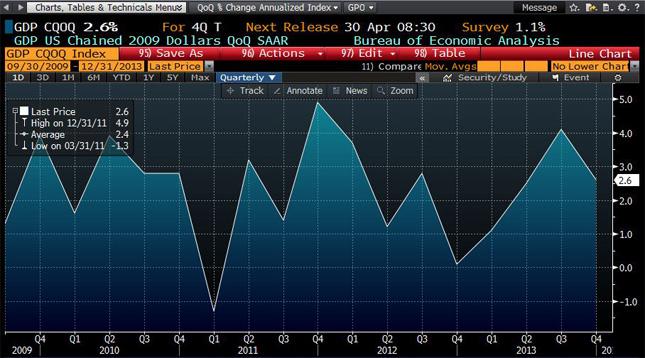
Only the United States economy is showing signs of life. But even there economic growth in the just ended first quarter is expected to have dropped to 1.1 percent annualized from 2.6 percent in the final three months of 2013. Is there justification for the recent optimism, evident in the Dow Jones close on Thursday’s at 16,501, less than 1.0 percent from its all-time high of 16,631 of April 4th?
Certain sectors of the American economy have improved, others such as housing, have faded and overall performance in the first quarter does seem to have been affected by the relatively harsh winter in two thirds of the country.
Statistics in three economic sectors, manufacturing, housing and business investment will give an indication of how the second half of the year may play out.
Manufacturing is considered by economists as a reliable leading sector for the overall economy. The most popular indicator is the Institute for Supply Managements’ purchasing managers’ index, which is not a measurement of past production but of managers’ sentiment on current and future business conditions.
American factories have maintained a steady if unspectacular expansion since last spring when the index dropped to 50.0 in April and May. The index registered 53.7 in March and April’s result, to be released on May 1st, is expected to be 54.0. The dividing line between contraction and expansion is 50.
The monthly average in the first quarter was 52.7. While the index has slipped from its 56.7 average in the fourth quarter, and is below the 54.4 average since the end of the recession in June 2009, it has risen each month since January.
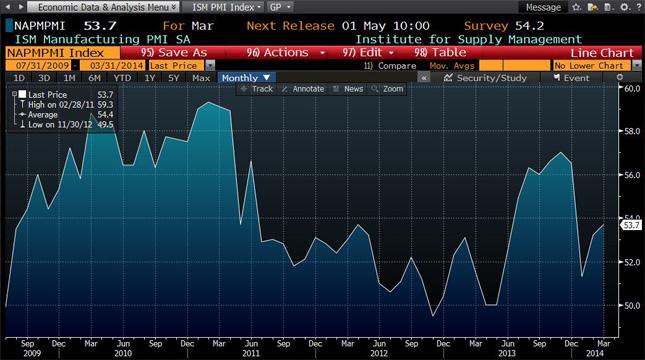
It has been 57 months since the end of the recession. The 54.4 average for that period is, surprisingly, a better record than for the same period after the end of the last three recessions, November 2001, March 1991 and November 1982. The five year average after the 2001 recession was 53.9, after 1991 it was 52.6 and following 1982 it recorded 54.0.
Whatever the other aspects of America’s economic record since the financial crisis the performance of the manufacturing sector is not only historically good but it has provided an accurate predictor of the overall economy.
The decline in GDP to 0.1 percent annualized in the last quarter of 2012 was foreseen by the drop in the ISM index from 53.7 in April to 49.5 in November, as was surge in GDP to 4.1 percent in the third quarter of the next year predicted by the gain from 50.0 in May 2013 to 57.0 in November. The current three month improvement likely presages GDP expansion between 2 and 3 percent in the second quarter on par with the 2.4 percent average since the end of the recession. It does not intimate a rapidly strengthening recovery.
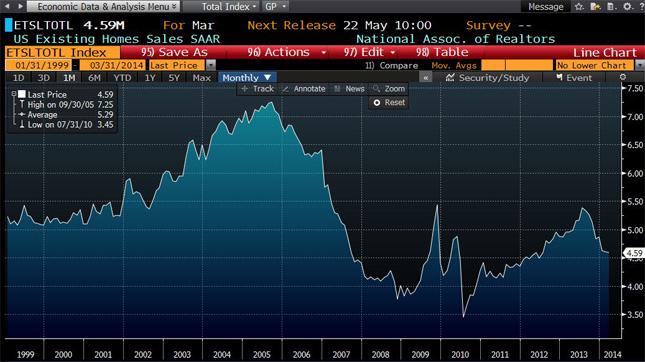
Housing is a different story. The long recovery from the depths of 2010 peaked late last year. Existing home sales in March were 4.59 million, annually down 14.7 percent from 5.38 million in July 2013. Other indicators have fallen commensurately. Housing starts are off 16.4 percent; new home sales have shrunk 18.3 percent and builder confidence in the NAHB Index has skidded from 58 last August and 56 in January to 47 in April.
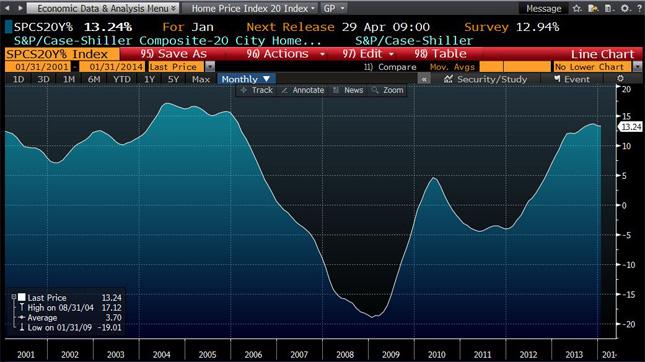
A combination of rapidly rising home prices, higher mortgage rates and a weak labor market have kept many potential owners from the market.
When the Case-Shiller 20-City Home Price Index reports for February on the 29th of this month it will record a full year of double digit prices increases, something not seen since the housing bubble in 2004 and 2005.
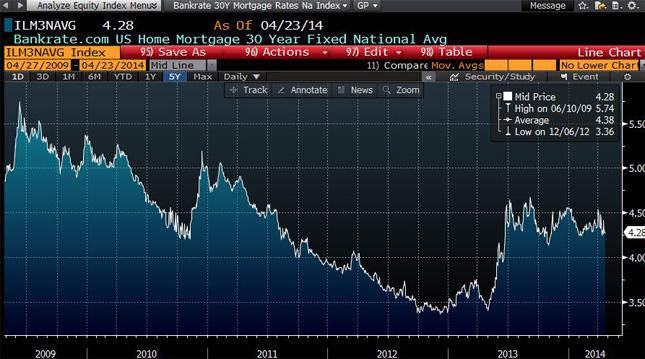
Mortgage rates have been relatively stable for the past ten months averaging 4.38 percent, ranging from 4.67 percent to 4.13 percent. That represents a sharp increase from the 3.55 percent average for the year before last May.
Job creation has averaged 178,000 per month over the past two years, up from the 160,000 average of the prior two years but not enough to return millions of long term unemployed to work. More importantly confidence has not returned to workers that they can find a job should they lose their current employment. Labor force participation remains near its record low.
These price, mortgage and employment conditions will not induce large numbers of home owners, rather than the recent mix of investors and opportunistic buyers, to enter the market. Without owners, as opposed to speculators, the market will continue to underperform its historical averages.
Business investment as tracked by the ‘capital goods non-defense ex-aircraft’ category of the Census Bureau’s durable goods orders has recovered from its 10 month negative track from June 2012 to March 2013 when it averaged -3.4 percent per month year over year.
In the first quarter of this year it averaged 1.8 percent with the rate strengthening from -2.1 percent in January to 4.5 percent in March. That average is less than the rate in each of the previous three quarters, Q-2 2013 5.1 percent, Q-3 7.7 percent and Q-4 4.9 percent, which helped produce GDP of 2.5 percent, 4.1 percent and 2.6 percent. Business investment is not enough, by itself, to propel the economy to stronger growth for more than a quarter or two. It is investment with a purpose, to serve greater sales. If those sales do not materialize the investment ceases as does its effect on GDP.
Stronger expansion in all of these sectors is necessary for the U.S. economy to improve on its 2.4 percent post-recession GDP average. As desirable as that may be there is nothing in these statistics that predicts an impending surge in American economic growth.
Recommended Content
Editors’ Picks
EUR/USD: The first upside target is seen at the 1.0710–1.0715 region

The EUR/USD pair trades in positive territory for the fourth consecutive day near 1.0705 on Wednesday during the early European trading hours. The recovery of the major pair is bolstered by the downbeat US April PMI data, which weighs on the Greenback.
GBP/USD rises to near 1.2450 despite the bearish sentiment

GBP/USD has been on the rise for the second consecutive day, trading around 1.2450 in Asian trading on Wednesday. However, the pair is still below the pullback resistance at 1.2518, which coincides with the lower boundary of the descending triangle at 1.2510.
Gold price struggles to lure buyers amid positive risk tone, reduced Fed rate cut bets

Gold price lacks follow-through buying and is influenced by a combination of diverging forces. Easing geopolitical tensions continue to undermine demand for the safe-haven precious metal. Tuesday’s dismal US PMIs weigh on the USD and lend support ahead of the key US data.
Crypto community reacts as BRICS considers launching stablecoin for international trade settlement

BRICS is intensifying efforts to reduce its reliance on the US dollar after plans for its stablecoin effort surfaced online on Tuesday. Most people expect the stablecoin to be backed by gold, considering BRICS nations have been accumulating large holdings of the commodity.
US versus the Eurozone: Inflation divergence causes monetary desynchronization

Historically there is a very close correlation between changes in US Treasury yields and German Bund yields. This is relevant at the current juncture, considering that the recent hawkish twist in the tone of the Fed might continue to push US long-term interest rates higher and put upward pressure on bond yields in the Eurozone.