$/cad nearer term outlook:
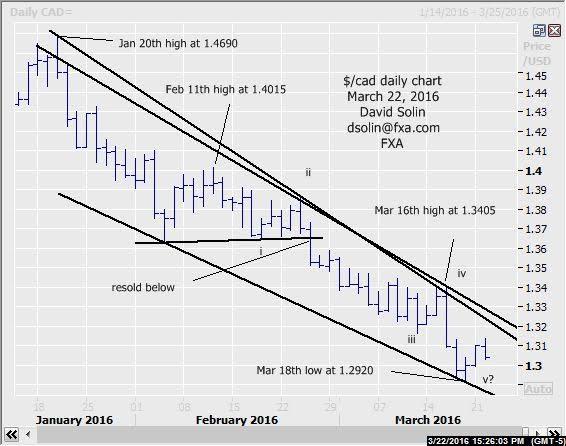
In the March 15th email once again affirmed the bearish view, adding that despite increasing positives there was still no confirmation of a low "pattern-wise" (5 waves up on shorter term chart for example). The market has indeed continued lower since, reaching a low at 1.2920 on Mar 18th (a level not seen since last Oct). No change as positives remain and include an oversold market after the decline from the Jan 20th high at 1.4690, potentially slowing downside momentum and seen within the final downleg in the decline from at least the Feb 11th high at 1.4015 (wave v). However, there is still no confirmation of even a short term bottom (and larger bottoms begin with smaller ones), and in turn leaves open scope for further downside. Remember as discussed in the past, positives are just signs of a "potential" approaching bottom and something to be aware of. However, these positives can stay in place for extended periods while the market continues lower. So generally prefer in these situations to stay with the bearish view/trend until there is confirmation of at least a near term reversal (5 waves up for example) as it would greatly increase the likelihood of a more substantial turn. Nearby support is seen at the recent 1.2915/25 low and the falling support line from Feb (currently at 1.2850/65). Nearby resistance is seen at the earlier 1.3135/50 high and the bearish trendline form Jan 18th (adjusts for that Jan 20th spike, currently at 1.3285/95). Bottom line : still no confirmation of even a short term low, but positives appearing.
Strategy/position:
Still short from the Feb 25th sell on the intraday break below 1.3620. For now would make a slight adjustment to that stop to a close 15 ticks above that bearish trendline from the Jan 18th high.
Long term outlook:
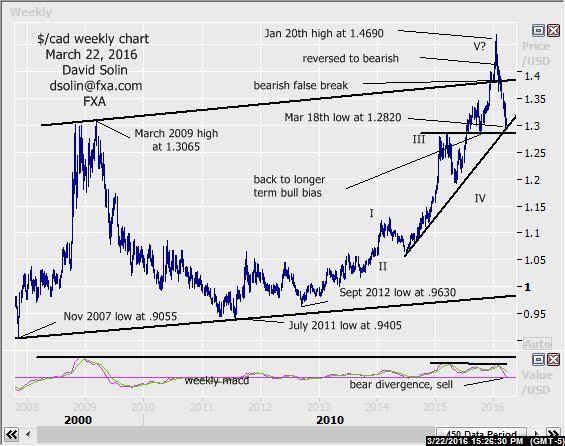
View since late Jan of a more major top (9-12 months) at that Jan 20th 1.4690 high, continues to play out. Negative long term technicals (see sell mode on the weekly macd), the bearish false break of that long mentioned 1.38/1.39 "pivotal" area (ceiling of bull channel from Nov 2007) and likely completion of the whole 5 wave rally from the Sept 2012 low at .9630 (wave V, see weekly chart/2nd chart below) support this view. But be warned, there is scope for a good sized, countertrend bounce (month and likely longer) as part of this longer term top/topping, and with some potential such a bottom may be nearing. Note that a number of commodities (inversely correlated, oil, copper, etc.) are seen in process of a multi-month period of wide ranging/bottoming and may nearing their upper end (see email from yesterday, my blog at www.fxa.com/solin/comments.htm ). Additionally, the market is within lots of long term support at 1.2720/1.2820 (recent low, bullish trendline from June 2014, broken high from march 2015, low from Oct 2015, see weekly chart/2nd chart below) and 1.2600/50 (38% retracement from the July 2011 low at 1.9405). But as discussed above, there is still no confirmation of even a short term low "pattern-wise" (and larger bottoms begin with smaller ones). Bottom line : view since late Jan of more major top remains but some rising potential for a good sized, countertrend bounce (month or 2).
Strategy/position:
Finally reversed that longer term bullish bias that was put in place Oct 15th at 1.2895 to bearish on Jan 26th at 1.4090 (1195 ticks, over 9% profit). At this point with rising potential of a bottom for at least a few weeks (and potentially more), would use the same exit as the shorter term above to switch to neutral, and maintain a good overall risk/reward in the position.
Recommended Content
Editors’ Picks
EUR/USD consolidates recovery below 1.0700 amid upbeat mood

EUR/USD is consolidating its recovery but remains below 1.0700 in early Europe on Thursday. The US Dollar holds its corrective decline amid a stabilizing market mood, despite looming Middle East geopolitical risks. Speeches from ECB and Fed officials remain on tap.
GBP/USD advances toward 1.2500 on weaker US Dollar

GBP/USD is extending recovery gains toward 1.2500 in the European morning on Thursday. The pair stays supported by a sustained US Dollar weakness alongside the US Treasury bond yields. Risk appetite also underpins the higher-yielding currency pair. ahead of mid-tier US data and Fedspeak.
Gold appears a ‘buy-the-dips’ trade on simmering Israel-Iran tensions

Gold price attempts another run to reclaim $2,400 amid looming geopolitical risks. US Dollar pulls back with Treasury yields despite hawkish Fedspeak, as risk appetite returns.
Manta Network price braces for volatility as $44 million worth of MANTA is due to flood markets

Manta Network price is defending support at $1.80 as multiple technical indicators flash bearish. 21.67 million MANTA tokens worth $44 million are due to flood markets in a cliff unlock on Thursday.
Investors hunkering down

Amidst a relentless cautionary deluge of commentary from global financial leaders gathered at the International Monetary Fund and World Bank Spring meetings in Washington, investors appear to be taking a hiatus.

