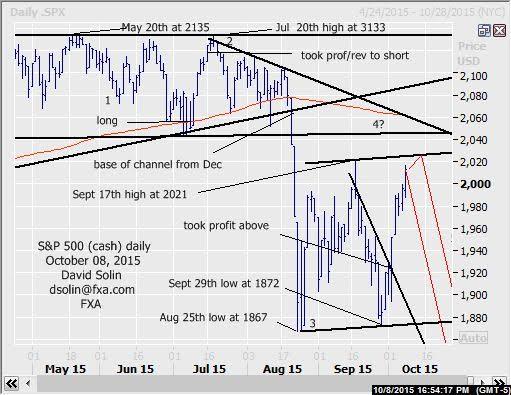
In the Oct 1st email and the market bouncing from the Sept 29th low at 1872, said there was scope for more wide ranging in the larger period of consolidating from the Aug 25th low. The market has indeed rallied sharply since, still seen part of this larger correction (wave 4 in the decline from the May high at 2135), and with a resumption of the declines below that 1867 low after (within wave 5). Though there is still no confirmation of even a shorter term peak so far (5 waves down for example), the market is nearing short term overbought and suggests that further gains would likely be limited/short lived (see in red on daily chart below). Note too this fits the view of a final downleg/washout across a number of markets "ideally" over the next few weeks/month, while this next downleg below 1867 could be sharp as we are nearing that often dangerous mid/late Oct timeframe. Nearby resistance is seen at 2021/26 (Sept 17th spike high, ceiling of bull channel from late Aug) and 2038/43 and 2062/67 (both the bearish trendline from July 21st and the 200 day moving average). Support is seen at 1950/55 and the base of the channel (currently at 1872/77). Bottom line : seen nearing the upper end of the large correction since Aug, with new lows below 1867 after.
Strategy/position:
Took profit/reversed to the short side on the Jul 9th buy at 2060 way back on July 16th at 2122 (60 pts) and took profit on that short on Oct 2nd above the bear trendline from Sept 18th (then at 1924, closed at 1951 for 171 points). For now with the recent surge seen part of the larger correction, would resell here (currently at 2013). With risk for more near term topping would use a wide stop on a close 5 pts above that bearish trendline from July. Would normally await confirmation of at least a short term top. But with risk of a sharp reversal/decline and frequency of these emails (generally updated once per week, don't want to risk missing such a move lower. A final comment, want to get more aggressive on nearby declines and especially on a break below the 1867 low, as that longer term "pivotal" area is just below in the 1800/20 area (see longer term below).
Long term outlook:
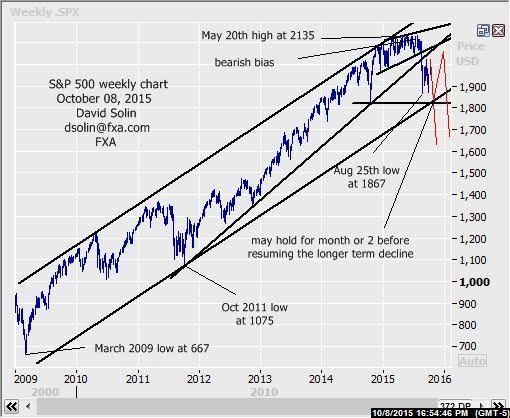
View of a major top in place at that May high at 2135 (for at least another 6-9 months or more) and after finally resolving lower from that long discussed bullish channel from Dec 2014 on Aug 20th (then at 2065), still playing out. A long term overbought market (after the surge from the March 2009 low at 667), long mentioned long term time cycles that peaked in early June (Bradley Model), the end of QE last Autumn (was seen as main driver to upside over the last few years) and still widespread complacency of a more significant decline (20%, 40% or more declines are not out of the ordinary historically) all support this longer term bearish view. But important to note that key "pivotal" support is just below that 1867 in the 1800/1820 area (both the base of the bullish channel since 2009 and the Oct 2014 low). Seen "pivotal" as this area could provide support for as much as a few months within this larger downtrend. However, a break could trigger a downside acceleration (don't want to use the "c" word) and with us within that dangerous mid/late Oct timeframe, is clearly a risk to be aware of (see in red on weekly chart/2nd chart below). Further support below there is seen at 1725/40 (38% retracement from the Oct 2011) and 1595/10 (50%). Bottom line : major top still seen in place at the May 2135 high, keep close eye on the "pivotal" 1800/20 area.
Long term strategy/position:
With an important top seen in place, would with the bearish bias that was put in place on July 16th at 2122.


Recommended Content
Editors’ Picks
EUR/USD clings to daily gains above 1.0650

EUR/USD gained traction and turned positive on the day above 1.0650. The improvement seen in risk mood following the earlier flight to safety weighs on the US Dollar ahead of the weekend and helps the pair push higher.
GBP/USD recovers toward 1.2450 after UK Retail Sales data

GBP/USD reversed its direction and advanced to the 1.2450 area after touching a fresh multi-month low below 1.2400 in the Asian session. The positive shift seen in risk mood on easing fears over a deepening Iran-Israel conflict supports the pair.
Gold holds steady at around $2,380 following earlier spike

Gold stabilized near $2,380 after spiking above $2,400 with the immediate reaction to reports of Israel striking Iran. Meanwhile, the pullback seen in the US Treasury bond yields helps XAU/USD hold its ground.
Bitcoin Weekly Forecast: BTC post-halving rally could be partially priced in Premium

Bitcoin price shows no signs of directional bias while it holds above $60,000. The fourth BTC halving is partially priced in, according to Deutsche Bank’s research.
Week ahead – US GDP and BoJ decision on top of next week’s agenda

US GDP, core PCE and PMIs the next tests for the Dollar. Investors await BoJ for guidance about next rate hike. EU and UK PMIs, as well as Australian CPIs also on tap.