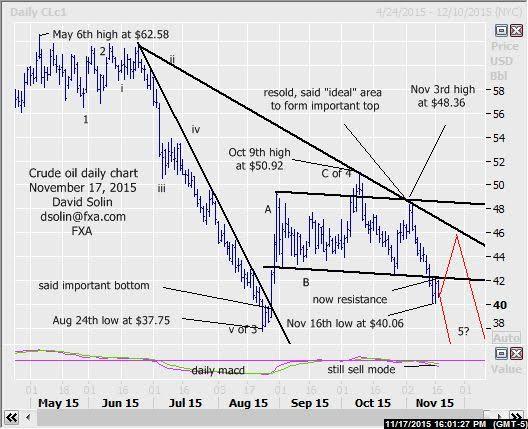
The market has indeed continued sharply lower from the Nov 3rd high at $48.36 and "ideal" area to form a more important top (see email from that day), with declines toward that Aug 24th low at $37.75 and even below still favored. Note that the action from Aug is seen as a large correction (wave 4 in the decline from the May 6th high at $62.58), was "completed" at the Oct 9th high at $50.92 (A-B-C), and targets those new lows. Weak technicals (see sell mode on the daily macd) and the seasonal chart that is lower into late Dec (see 3rd chart below) continue to support this long held bearish view. On a short term basis, there is some risk for a week or 2 of consolidating, but would be seen as a correction and with a resumption of the declines after (see in red on daily chart below). Nearby resistance is at the broken base of the bull channel from Sept/neckline of the head and shoulders pattern (currently at $42.25/50), with a break/close above increasing the likelihood of that near term period of consolidating. Further resistance above there is seen at the bearish trendline from June (currently at $47.25/50). Nearby support is seen at the widely discussed $39.85/10 area (Nov 16th low, likely stops below). Bottom line: declines below the Aug low at $37.75 still favored, some risk for a week or 2 of consolidating on the way lower.
Strategy/position:
Still short from the Nov 3rd resell at $47.92. For now would switch the stop to a close $0.25 above the broken neckline of that head and shoulders as it would argue that week or 2 of correcting (and would be looking to resell higher if taken out). Note had been using stop on a close $0.25 above that bearish trendline from the Nov 3rd high, but the pace of further downside is likely to slow at a minimum.
Long term outlook:
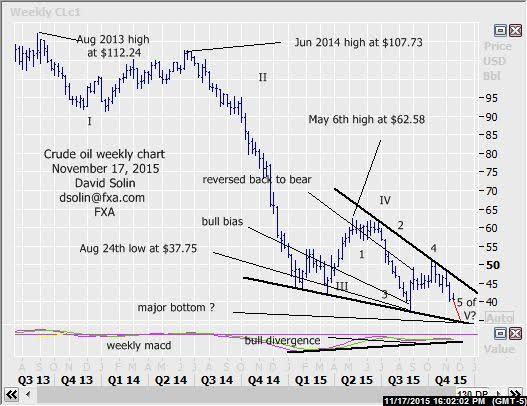
No change as the view over the last few months of eventual declines below that Aug low at $37.75 continues to unfold. Longer term however, such new lows may be limited, part of a longer term bottoming and versus the start of a more major, new tumble. Note that a decline below the $37.75 low would be seen as the final downleg in the fall from the May high (wave 5) as the well as the longer term fall from the Aug 2013 high at $112.24 (wave V). Additionally, long term technicals did no confirm that Aug low (see bullish divergence on the weekly macd for example), downside momentum has been slowing for the last year and appear to be forming a large falling wedge/reversal pattern over that time. Key long term support below $37.75 is seen at the year long falling trendline/base of the wedge (currently at $34.00/50) and would be an "ideal" area to form a more major bottom (see in red on weekly chart/2nd chart below). A final comment....the long discussed view of downside (potentially final "washout" before completing major bottoms) into mid/late Dec across a number commodities (gold, copper, etc.) and commodity currencies (A$, new highs in $/cad, etc.) is indeed playing out. Bottom line: declines below $37.75 still favored, but may be limited in the bigger picture, and part of a more major bottoming.
Strategy/position:
Reversed the longer term bullish bias that was put in place on Aug 27th at $40.00 to bearish on Sept 3rd at $48.00.


Recommended Content
Editors’ Picks
EUR/USD extends gains above 1.0700, focus on key US data

EUR/USD meets fresh demand and rises toward 1.0750 in the European session on Thursday. Renewed US Dollar weakness offsets the risk-off market environment, supporting the pair ahead of the key US GDP and PCE inflation data.
GBP/USD extends recovery above 1.2500, awaits US GDP data

GBP/USD is catching a fresh bid wave, rising above 1.2500 in European trading on Thursday. The US Dollar resumes its corrective downside, as traders resort to repositioning ahead of the high-impact US advance GDP data for the first quarter.
Gold price edges higher amid weaker USD and softer risk tone, focus remains on US GDP

Gold price (XAU/USD) attracts some dip-buying in the vicinity of the $2,300 mark on Thursday and for now, seems to have snapped a three-day losing streak, though the upside potential seems limited.
Injective price weakness persists despite over 5.9 million INJ tokens burned

Injective price is trading with a bearish bias, stuck in the lower section of the market range. The bearish outlook abounds despite the network's deflationary efforts to pump the price.
US Q1 GDP Preview: Economic growth set to remain firm in, albeit easing from Q4

The United States Gross Domestic Product (GDP) is seen expanding at an annualized rate of 2.5% in Q1. The current resilience of the US economy bolsters the case for a soft landing.