Nearer term $ index outlook:
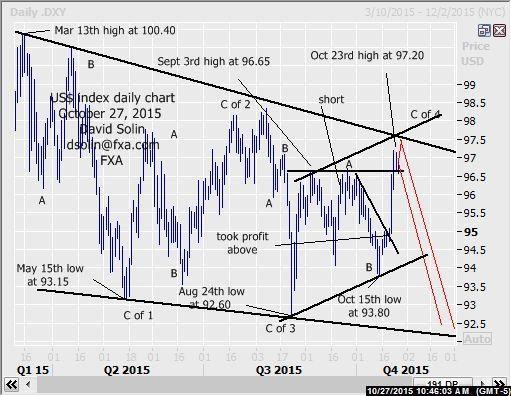
The market has continued upward from that Oct 15th low at 93.80, accelerating on a break above that bearish trendline from Oct 1st and trying to consolidate from the Oct 23rd high at 97.20. Still seen part of the very long discussed, extended period of wide ranging since the March high at 100.40. Though eventual new highs above 100.40 are favored, there remains scope for another month or 2 of this broad ranging first (see longer term below). Short term with the market near term overbought and lots of resistance just above that recent 97.20 high in the 97.40/65 area (62% retracement and bearish trendline from that March high at 100.40, top of bull channel from late Aug), any further gains would likely be limited/part of a topping. Note too that there is scope for a more important top to form as a larger wedge-like pattern since March may be in process. Though these are reversal patterns, they break down into 5 legs and raises scope for declines all the way back to the Aug 24th low at 92.60 and even slightly below within that final leg (see in red on daily chart below). Nearby support is seen at 96.50/65 (broken highs from Sept). Bottom line: any further gains may be limited/part of a topping (and potentially more major topping).
Strategy/position:
Took profit on Sept 22nd sell at 96.30 on Oct 21st above that bear trendline from Oct 1st (then 94.85, closed at 95.05 for 125 ticks). For now with any further upside seen limited and potential of a more significant top forming, would sell here (currently at 96.90). Initially stop on a close 20 ticks above that bearish trendline/top of potential wedge from March (to allow for more nearby topping).
Long term outlook:
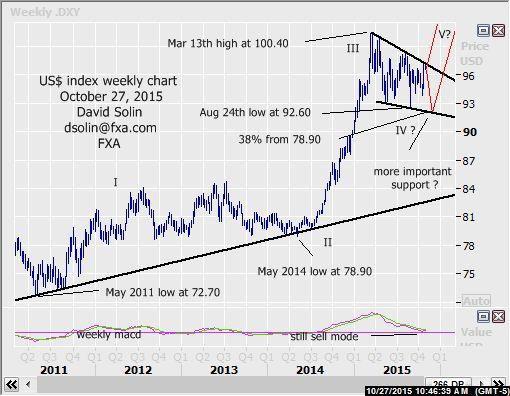
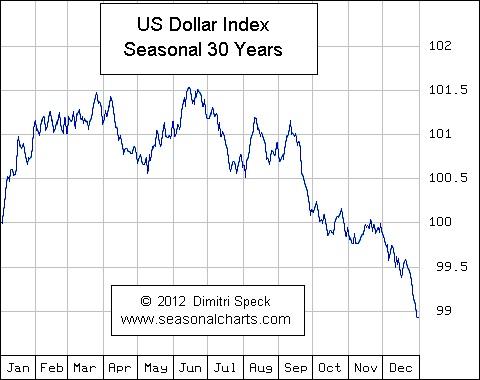
Very long held view of an extended period of wide consolidating (number of months) from that March high at 100.40 as the market consolidates the huge surge from the May 2014 low at 78.90 (wave IV in the rally from the May 2011 low at 72.70), and with eventual new highs after (within wave V), continues to play out. But as been discussing more consolidating is favored first, "ideally" into the end of the year before resuming that longer term upmove. Note that long term technicals remain bearish (see sell mode on the weekly macd) and the seasonal chart is lower into the end of the year (see 3rd chart below) and with both supporting the view of another few months of broad ranging before resuming that long term upmove. Also, that long mentioned, major support remains just below the Aug low at 92.60 in the 92.00/25 area (38% retracement from the May 2014 low at 78.90/wave III and the base of that potential wedge since March). Markets have a way of reaching these key area, declines there "fits" the shorter term view (see above) and would be an "ideal" area to form a more major bottom (see in red on weekly chart/2nd chart below). Bottom line: trade from March seen as a large correction with eventual new highs above 100.40, but with scope for as much as another few months of wide ranging/consolidating "ideally" into the 92.00/25 area.
Strategy/position:
With scope at least some further declines below the 92.60 low as part of this larger period of wide consolidating, would stay with the longer term bearish bias that was put in place on Aug 26th at 94.75. However with the magnitude of further downside a question, will be looking to reassess on such further lows.
Current:
Near term: short Oct 27th at 96.90, topping (potentially important topping) seen in process.
Last: short Sep 22 at 96.25, took profit Oct 21 above t-line from Oct 1 (94.85, closed 95.05, 125 ticks).
Longer term: bearish bias Aug 26th at 94.75, but magnitude of downside below 92.60 a question.
Last: bear bias Jun 23rd at 95.50 to neutral Jul 15th at 97.15.
US Dollar Index
Recommended Content
Editors’ Picks
AUD/USD recovers to near 0.6450, shrugs off mixed Australian jobs data

AUD/USD is rebounding to near 0.6450 amid renewed US Dollar weakness in the Asian session on Thursday. The pair reverses mixed Australian employment data-led minor losses, as risk sentiment recovers.
USD/JPY bounces back toward 154.50 amid risk-recovery

USD/JPY bounces back toward 154.50 in Asian trading on Thursday, having tested 154.00 on the latest US Dollar pullback and Japan's FX intervention risks. A recovery in risk appetite is aiding the rebound in the pair.
Gold rebounds on market caution, aims to reach $2,400

Gold price recovers its recent losses, trading around $2,370 per troy ounce during the Asian session on Thursday. The safe-haven yellow metal gains ground as traders exercise caution amidst heightened geopolitical tensions in the Middle East.
Manta Network price braces for volatility as $44 million worth of MANTA is due to flood markets

Manta Network price was not spared from the broader market crash instigated by a weakness in the Bitcoin market. While analysts call a bottoming out in the BTC price, the Web3 modular ecosystem token could suffer further impact.
Investors hunkering down

Amidst a relentless cautionary deluge of commentary from global financial leaders gathered at the International Monetary Fund and World Bank Spring meetings in Washington, investors appear to be taking a hiatus after witnessing significant market movements in recent weeks.


