S&P 500 (cash) near term outlook:
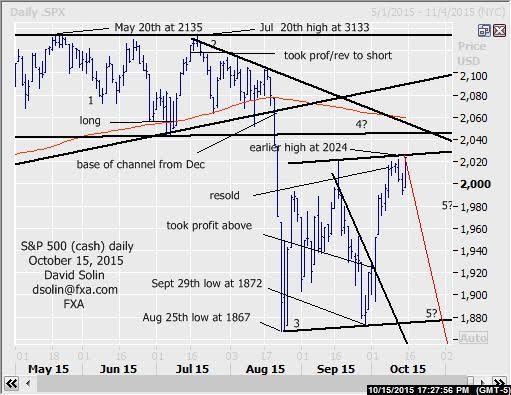
The market remains firm near recent highs and testing lots of resistance in the 2024/33 area (both the ceiling of the bullish channel from the Aug 25th low at 1867 and a 62% retracement from the May high at 2135). Seen part of a larger correction from the Aug 24th low at 1867 (wave 4 the decline from that May high) and with eventual declines below there after (within wave 5). Though there is no confirmation of even a shorter term peak so far (5 waves down for example), the market is overbought after the last few weeks of sharp gains and within an "ideal" area to form such a top. Note too that the market is within the often dangerous mid/late Oct timeframe and raises the risk that such a move lower (if it does indeed occur) may be sharp. Further resistance above 2024/33 is seen at 2055/60 (both the bearish trendline from July and the 200 day moving average). Nearby support is seen at 1990/93 and 1945/50. Bottom line : seen nearing the upper end of the large correction since Aug, with new lows below 1867 after.
Strategy/position:
Still short from the Oct 8th resell at 2013. At this point, with no confirmation of a top and risk for further (but likely limited) gains, would continue to use that wide stop on a close 5 pts above that bearish trendline from July. However, with the magnitude of initial declines below that 1867 low potentially limited and short lived (see longer term below), will want to get more aggressive on nearby weakness and especially a break below.
Long term outlook:
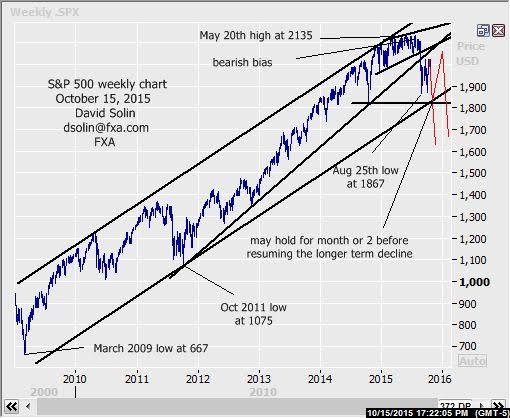
Long held view of a major top in place at that May high at 2135 (for at least another 6-9 months and likely longer) and after finally resolving lower from that long discussed bullish channel from Dec 2014 on Aug 20th (then at 2065), still playing out. A still long term overbought market (after the surge from the March 2009 low at 667), the end of QE last Autumn (was seen as main driver to upside over the last few years), continued widespread complacency in regards to a more significant decline (20%, 40% or more declines are not out of the ordinary historically) and that longer term time cycle that peaked in early June (Bradley Model) all support this continued, longer term bearish view. But note that "pivotal" big picture support is just below that Aug 1867 low in the 1800/20 area (both the base of the bullish channel since 2009 and the Oct 2014 low). Seen as "pivotal" as it could provide as much as a few months of consolidating within this longer term downtrend. However, breaking below could trigger a downside acceleration and with the market within that dangerous mid/late Oct timeframe is a risk to aware of (won't use the "c" word, see weekly chart/2nd chart below). Further long term support below there is seen at 1725/40 (8% retracement from the Oct 2011 low at 1075) and 1595/10 (50%). Bottom line : major top still seen in place at the May 2135 high, keep close eye on the "pivotal" 1800/20 area.
Long term strategy/position:
With an important top seen in place, would stay with the bearish bias that was put in place on July 16th at 2122.
Recommended Content
Editors’ Picks
EUR/USD rises toward 1.0700 after Germany and EU PMI data

EUR/USD gains traction and rises toward 1.0700 in the European session on Monday. HCOB Composite PMI data from Germany and the Eurozone came in better than expected, providing a boost to the Euro. Focus shifts US PMI readings.
GBP/USD holds above 1.2350 after UK PMIs

GBP/USD clings to modest daily gains above 1.2350 in the European session on Tuesday. The data from the UK showed that the private sector continued to grow at an accelerating pace in April, helping Pound Sterling gather strength.
Gold price flirts with $2,300 amid receding safe-haven demand, reduced Fed rate cut bets

Gold price (XAU/USD) remains under heavy selling pressure for the second straight day on Tuesday and languishes near its lowest level in over two weeks, around the $2,300 mark heading into the European session.
Here’s why Ondo price hit new ATH amid bearish market outlook Premium

Ondo price shows no signs of slowing down after setting up an all-time high (ATH) at $1.05 on March 31. This development is likely to be followed by a correction and ATH but not necessarily in that order.
US S&P Global PMIs Preview: Economic expansion set to keep momentum in April

S&P Global Manufacturing PMI and Services PMI are both expected to come in at 52 in April’s flash estimate, highlighting an ongoing expansion in the private sector’s economic activity.

