Near term US 10 year note yield outlook:
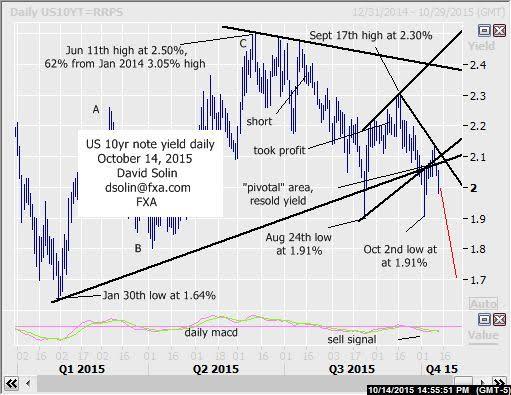
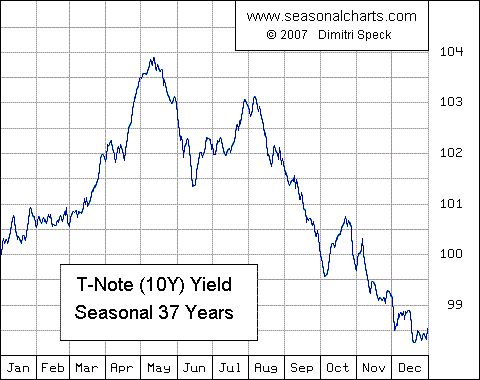
The market did indeed turned lower from the previously discussed "pivotal" area near 2.07/10% (never closed above, broken bull trendline from Jan, broken base of the bull channel from Aug), targeting declines back to the Aug/Oct 2nd lows at 1.90/92% and even below ahead. Note that weak technicals (see sell mode on the daily macd), the seasonal chart that declines into the end of the year (see 3rd chart below) and view of an important topping in the S&P 500 (and scope for a few weeks of sharp declines, would likely lead to lower yields due to safe haven buying) support this near term negative view. Bigger picture, long held view of eventual new lows below that Jan low at 1.64% also remains in place as the upmove from that low to the June high at 2.50% occurred in 3 waves (A-B-C, argues a correction). But be warned, there remains scope for as much as another few months of wide ranging first. So there is risk that the nearer term declines below 1.90/92% may be limited (as part of this potential, continued period of wide ranging). Nearby resistance is seen at the bearish trendline from Sept 17th (currently in that 2.07/10% area). Bottom line: declines below 1.90/92% favored, but the magnitude of further, near term weakness is a question (at least initially).
Strategy/position:
Still short from the Oct 7th resell of yield at 2.07%. For now would stop on a close .02 above that bearish trendline from Sept, but will want to get much more aggressive on a move below 1.90/92% to reflect that risk that further weakness may be limited (at least initially)
Long term outlook:
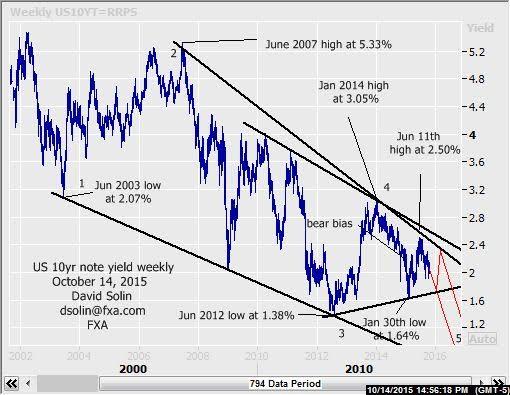
As discussed above, eventual new lows below that Jan low at 1.64% is favored and "fits" the very long held view (years) of an extended period of wide chopping lower, as the market forms that huge falling wedge since 2003. These patterns break down into 5 legs and continues to target new lows below 1.38% (as well as that 1.64% low) within that final leg. But as discussed above, there remains scope for a more extended period of wide consolidating (months) before those new lows are seen (see in red on weekly chart/2nd chart below). Key resistance remains just above that 2.50% at 2.60/75% (ceiling of the huge wedge) with a break/close clearly above arguing that a more major low is already in place. Bottom line : still in huge falling wedge since 2003 with eventual declines below 1.64%, as well as that June 2012 low at 1.38%, still favored (may be an extended period of time before such new lows are seen).
Strategy/position:
Switched the bias to the bearish side way back on Dec 17th at 2.09%. And with eventual new lows below 1.38% still favored and an important top seen in place, would stay with that bias for now.
Recommended Content
Editors’ Picks
AUD/USD posts gain, yet dive below 0.6500 amid Aussie CPI, ahead of US GDP

The Aussie Dollar finished Wednesday’s session with decent gains of 0.15% against the US Dollar, yet it retreated from weekly highs of 0.6529, which it hit after a hotter-than-expected inflation report. As the Asian session begins, the AUD/USD trades around 0.6495.
USD/JPY finds its highest bids since 1990, approaches 156.00

USD/JPY broke into its highest chart territory since June of 1990 on Wednesday, peaking near 155.40 for the first time in 34 years as the Japanese Yen continues to tumble across the broad FX market.
Gold stays firm amid higher US yields as traders await US GDP data

Gold recovers from recent losses, buoyed by market interest despite a stronger US Dollar and higher US Treasury yields. De-escalation of Middle East tensions contributed to increased market stability, denting the appetite for Gold buying.
Ethereum suffers slight pullback, Hong Kong spot ETH ETFs to begin trading on April 30

Ethereum suffered a brief decline on Wednesday afternoon despite increased accumulation from whales. This follows Ethereum restaking protocol Renzo restaked ETH crashing from its 1:1 peg with ETH and increased activities surrounding spot Ethereum ETFs.
Dow Jones Industrial Average hesitates on Wednesday as markets wait for key US data

The DJIA stumbled on Wednesday, falling from recent highs near 38,550.00 as investors ease off of Tuesday’s risk appetite. The index recovered as US data continues to vex financial markets that remain overwhelmingly focused on rate cuts from the US Fed.


