US Crude Oil Supply Situation
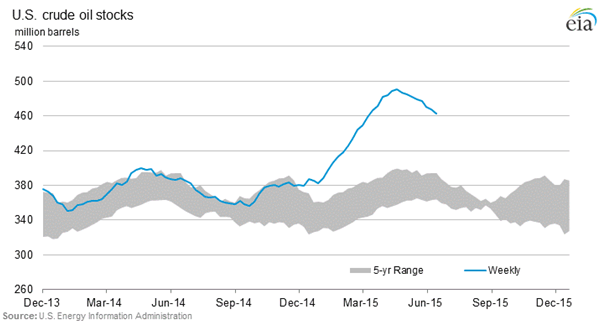
Crude oil supply has been on a steady rise globally and the US has shown to be no exception.The graph below plots US Crude Oil stocks, showing a sharp increase in supply From December 2014, we can also see that stock levels have been on the higher end of the 5 year range for the past couple of years. Increased production may have contributed to the steady decrease in price over the last year.

There has also been a lot of talk recently that US Congress will lift the 40-year-old Crude Oil export ban, with a lot of pressure on both sides of the pond for that restriction to come down, ears are pinned to the ground on this one as it could greatly increase world supply.
World Crude Oil Supply
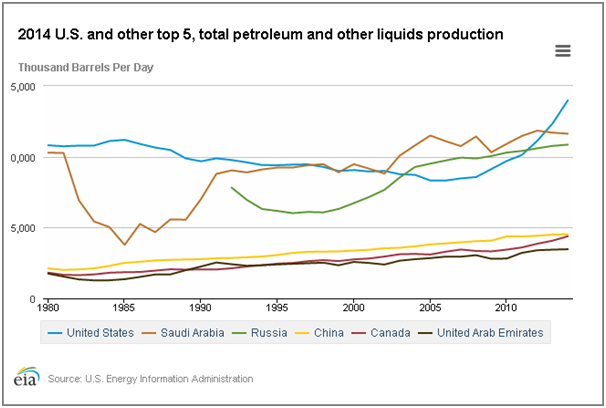
Looking at the chart for the USA and the next Top 5 Petroleum producing countries we can see the overall steady, if modest, increase in production by all nations. Production in the US stands out for being the fastest growing. Latest data from EIA, released 1st July, indicated Crude Oil Stock at + 2.386 million Barrels for 26th June, when -2.075 mln was expected and -4.934 mln was the previous months figure. Hence, the actual result took traders by surprise and we saw the price of Crude Oil drop over 3%.
Iran has the fourth largest reserves in the world, but its production and export has been hindered due to sanctions imposed by the EU and the USA. Talks are currently in place whereby a deal may be reached over Iran’s nuclear programme, this would probably lead to some loosening of those sanctions and more Oil supply.
Saudi Arabia has the world’s largest Crude Oil production at just over 11 million barrels per day, OPEC has decided not to reduce production, however any changes in supply by this organization, in particular if Saudi Arabia acts independently like it has in the past, can greatly see price affected with sharp increases.
How to trade Crude Oil using options!
Let’s say you see a news headline or data release that indicates the price of Crude Oil may go UP over the few days. You may buy a Call option with a short-term expiry because a Call gives you the right, but not the obligation, to BUY Oil at a specified price over a certain period of time. The ‘specified’ price is known as the strike.
The below image is a trade example on the optionsReasy platform. You can choose WTI OIL, click under the word 'strike' to choose your strike level, then choose the 'expiry' on the pop up calendar and insert the amount of barrels you want to buy under 'amount'. In the box under the word Buy you see the total cost of your Option, this is also your maximum risk.
In this example we are buying a Call with strike price $57, expiry 5-days and amount of 100 barrels. That is, we will hold the right to buy 100 barrels of oil at $57 over the next 5-days. If the price of Crude Oil rises above $57 in the next 5-days the Call option's value will rise. This option costs 68.07 USD (43.55 GBP).
Clicking on Trade Now will buy you the Call Option and you can monitor real-time profit/loss from the open positions screen. You do not have to hold the option until expiry, you close the trade at anytime to lock-in profit or reduce a loss.

On the other hand you may run into news that would indicate a fall in the price of WTI OIL. In this case you may take advantage of this possible price change through buying a Put option, because a Put gives the right, but not the obligation, to SELL at a strike price over a certain period of time.
When clicking on the Add Position button all you need to do is the same as mentioned above for the Call, but change the type, clicking on the box beneath the word ‘type’ will give you the possibility of choosing a Put Option.
In the image below is a Put option example, with strike $56, expiry 7-days and amount 100 barrels. That is, the right to sell 100 barrels of oil at $56 over the next week. If the price of oil falls below $56 the option’s value will rise. The cost to buy the option is 78.06 USD (49.93 GBP) this is also your maximum risk.

The content provided is made available to you by ORE Tech Ltd for educational purposes only, and does not constitute any recommendation and/or proposal regarding the performance and/or avoidance of any transaction (whether financial or not), and does not provide or intend to provide any basis of assumption and/or reliance to any such transaction.
Recommended Content
Editors’ Picks
AUD/USD posts gain, yet dive below 0.6500 amid Aussie CPI, ahead of US GDP

The Aussie Dollar finished Wednesday’s session with decent gains of 0.15% against the US Dollar, yet it retreated from weekly highs of 0.6529, which it hit after a hotter-than-expected inflation report. As the Asian session begins, the AUD/USD trades around 0.6495.
USD/JPY finds its highest bids since 1990, approaches 156.00

USD/JPY broke into its highest chart territory since June of 1990 on Wednesday, peaking near 155.40 for the first time in 34 years as the Japanese Yen continues to tumble across the broad FX market.
Gold stays firm amid higher US yields as traders await US GDP data

Gold recovers from recent losses, buoyed by market interest despite a stronger US Dollar and higher US Treasury yields. De-escalation of Middle East tensions contributed to increased market stability, denting the appetite for Gold buying.
Ethereum suffers slight pullback, Hong Kong spot ETH ETFs to begin trading on April 30

Ethereum suffered a brief decline on Wednesday afternoon despite increased accumulation from whales. This follows Ethereum restaking protocol Renzo restaked ETH crashing from its 1:1 peg with ETH and increased activities surrounding spot Ethereum ETFs.
Dow Jones Industrial Average hesitates on Wednesday as markets wait for key US data

The DJIA stumbled on Wednesday, falling from recent highs near 38,550.00 as investors ease off of Tuesday’s risk appetite. The index recovered as US data continues to vex financial markets that remain overwhelmingly focused on rate cuts from the US Fed.