Financial markets in Europe and the US are among those that are closed today. The Good Friday session sees markets in Japan, China and South Korea open.
The greenback rose against a basket of peers after yesterday’s data showed manufacturing in the Philadelphia region grew at the fastest pace in seven months, and jobless claims reports showed that the number of Americans filing for unemployment insurance payments hovered near a seven-year low. Yesterday’s data helped the dollar erase losses against most major currencies.
In Canada, the nation’s CPI rate rebounded to +1.5% yoy in March from +1.1% yoy in February, exceeding estimates of +1.4% yoy. The loonie strengthened against the dollar at the time of the release, but gave back its gains a few hours later. I expect the loonie to weaken in the near future given that the Bank of Canada said that a weakening local currency would support the nation’s exports.
The AUD headed for its biggest weekly loss since January.
The yen slipped after United States, Russia, Ukraine and the European Union called for an immediate halt to violence. The worries about tension in the Ukraine has prompted some safe-haven buying of the yen.
THE MARKET
EUR/USD
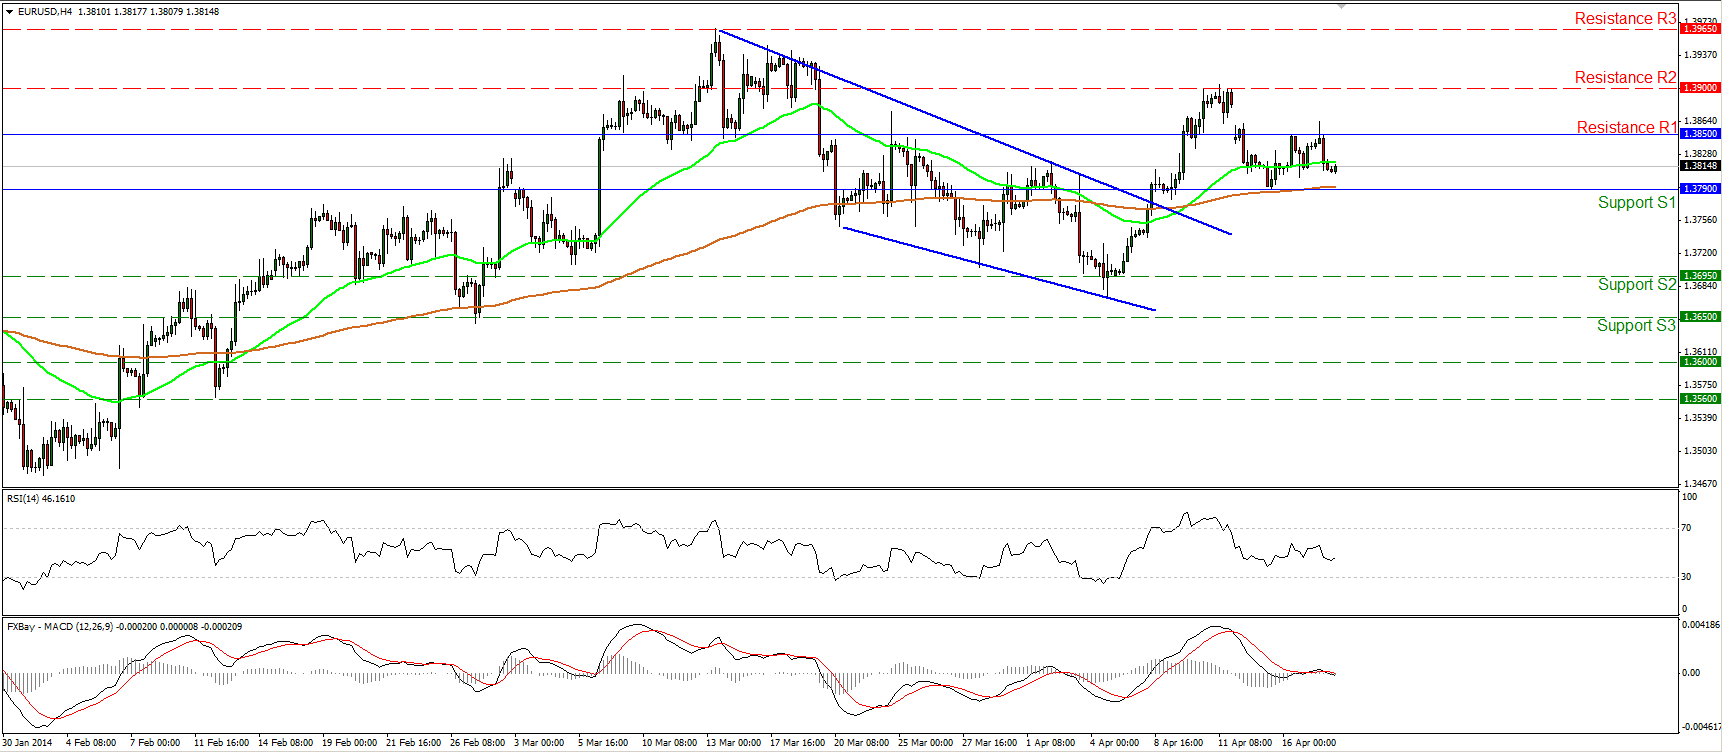
EUR/USD tried to overcome the 1.3850 (R1) bar but failed to do so and moved lower. The rate is trading within a narrow range between that resistance and the support of 1.3790 (S1). The readings of both our momentum indicators are near their neutral levels, while both the moving averages are pointing sideways. This confirms the consolidative mode of the currency pair. A break above 1.3850 (R1) may challenge the resistance of 1.3900 (R2). A violation of the later bar would signal the continuation of the upside path and perhaps pave the way towards the 1.3965 (R3) obstacle.
Support: 1.3790 (S1), 1.3695 (S2), 1.3650 (S3).
Resistance: 1.3850 (R1), 1.3900 (R2), 1.3965 (R3).
EUR/JPY
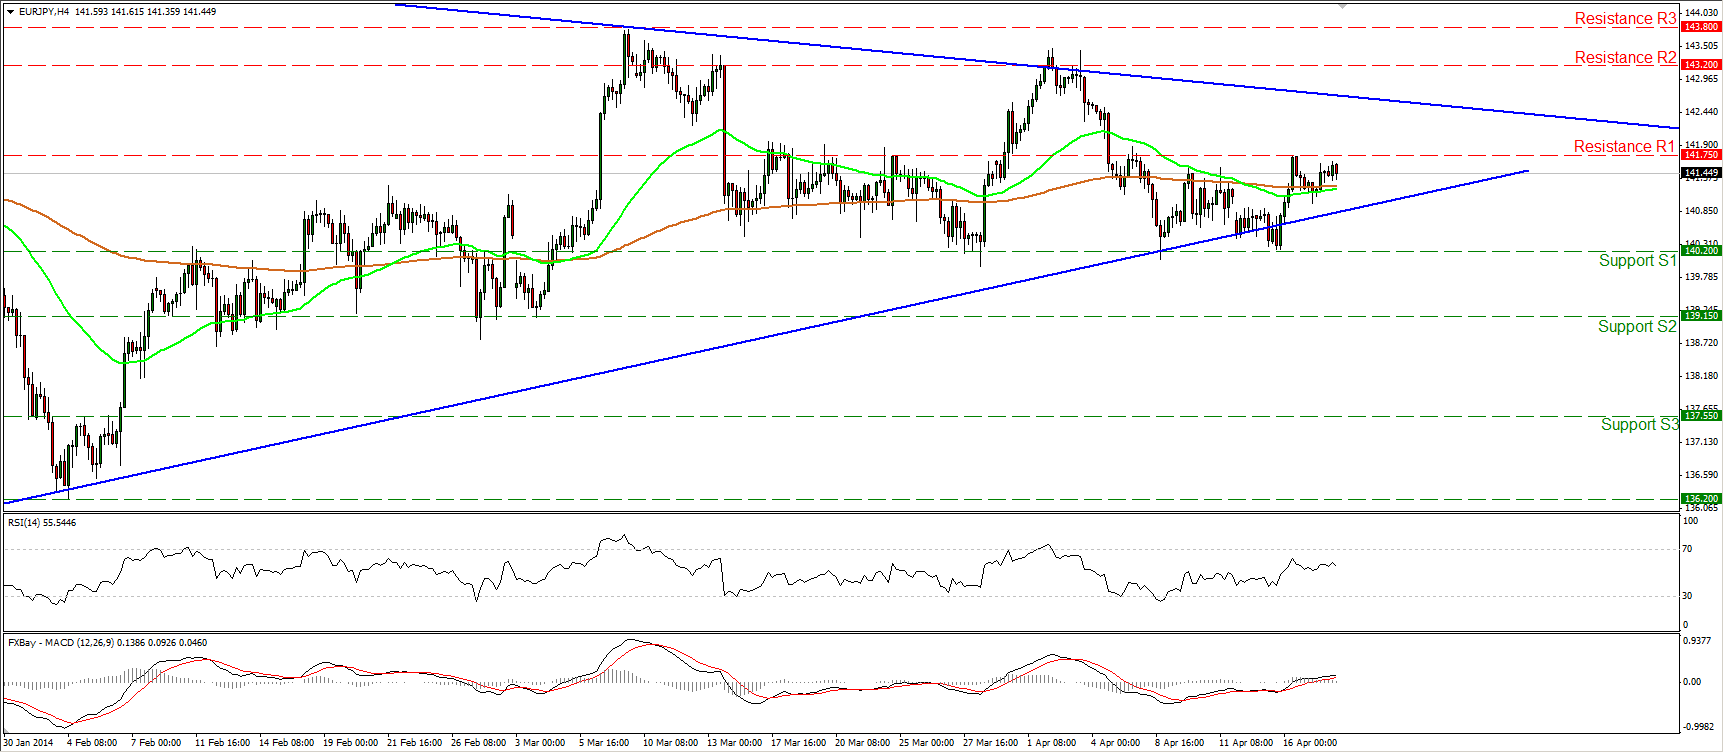
EUR/JPY moved slightly higher to trade once more slightly below the 141.75 (R1) resistance. The rate continues its sideways path and this is confirmed by the neutral readings of the daily MACD and the daily RSI. The non-trending mode is also confirmed by both the moving averages, which are pointing sideways. In the bigger picture, the rate remains within the triangle formation identified on the daily chart.
Support: 140.20 (S1), 139.15 (S2), 137.55 (S3).
Resistance: 141.75 (R1), 143.20 (R2), 143.80 (R3).
GBP/USD
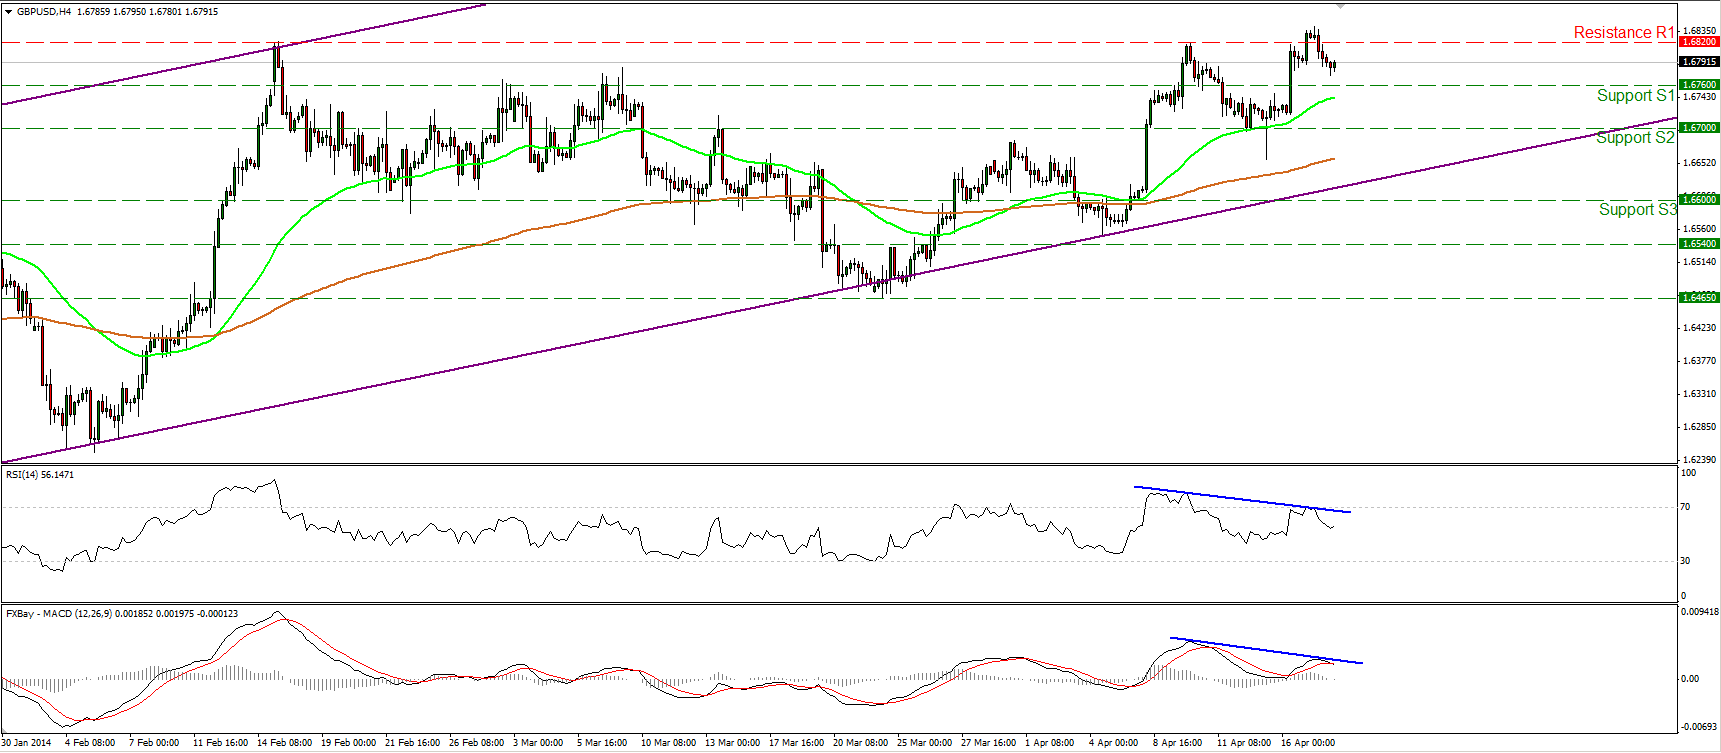
GBP/USD failed to maintain its rate above the 1.6820 (R1) bar and moved lower. Considering negative divergence between our momentum studies and the price action, I would expect the correcting phase to continue. On the daily chart we can identify a shooting star candle formation, increasing the probabilities for the continuation of the retracement. Nonetheless, in the bigger picture, cable remains within the upward sloping channel, keeping the long-term outlook to the upside.
Support: 1.6760 (S1), 1.6700 (S2), 1.6600 (S3).
Resistance: 1.6820 (R1), 1.6885 (R2), 1.7000 (R3).
GOLD
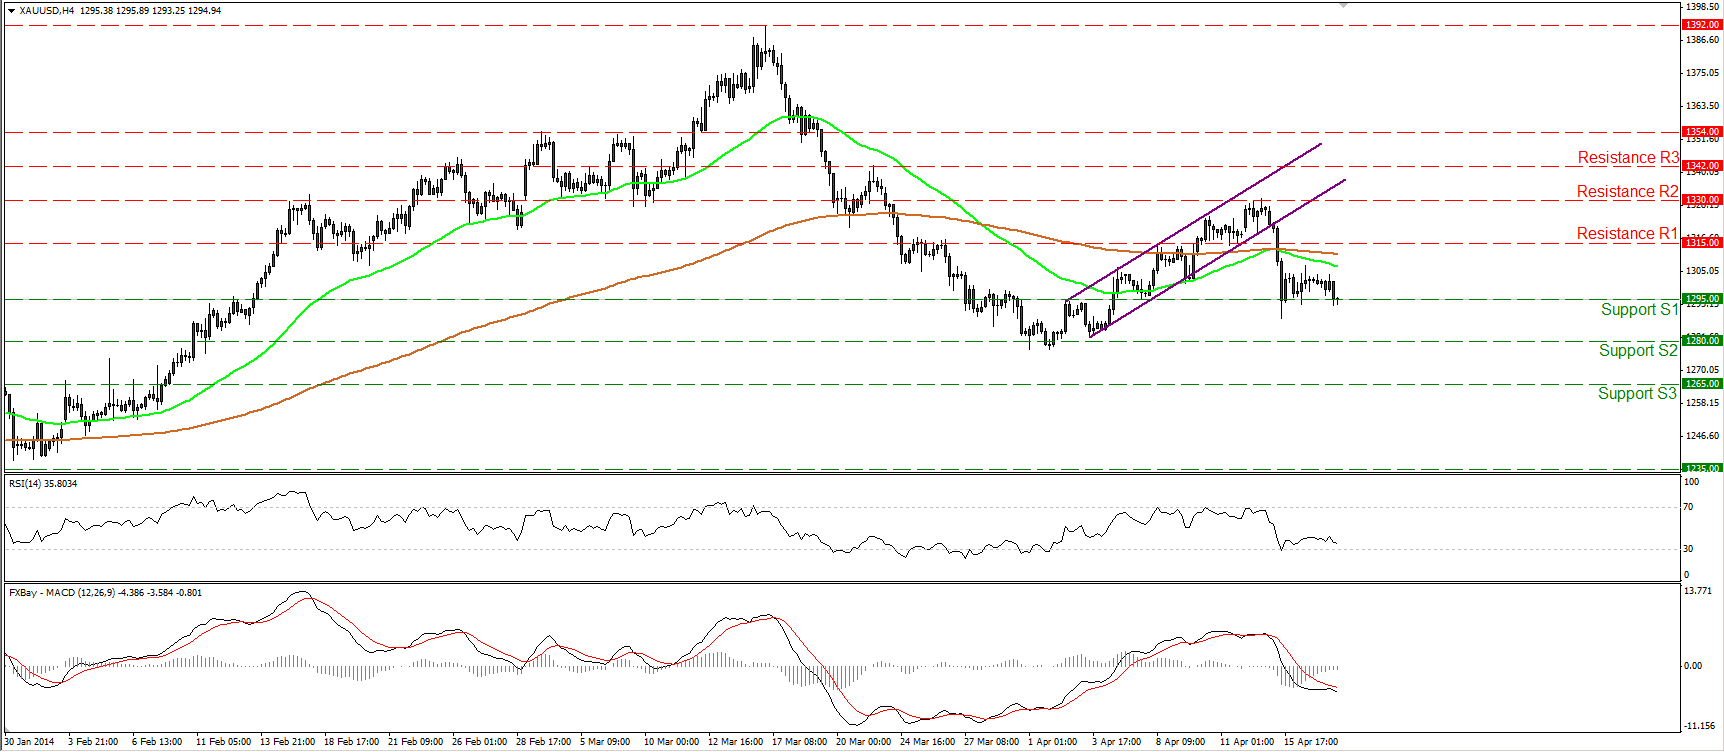
Gold continued moving sideways, remaining supported by the 1295 (S1) bar. At the time of writing, the precious metal is testing that support and if the bears are strong enough to drive the battle below it, I would expect them to target the next hurdle at 1280 (S2). The MACD remains below both its trigger and zero lines, keeping the momentum to the downside. As long as the precious metal is trading below both the moving averages and the resistance bar of 1315 (R1), the short-term outlook remains negative.
Support: 1295 (S1), 1280 (S2), 1265 (S3).
Resistance: 1315 (R1), 1330 (R2), 1342 (R3).
OIL
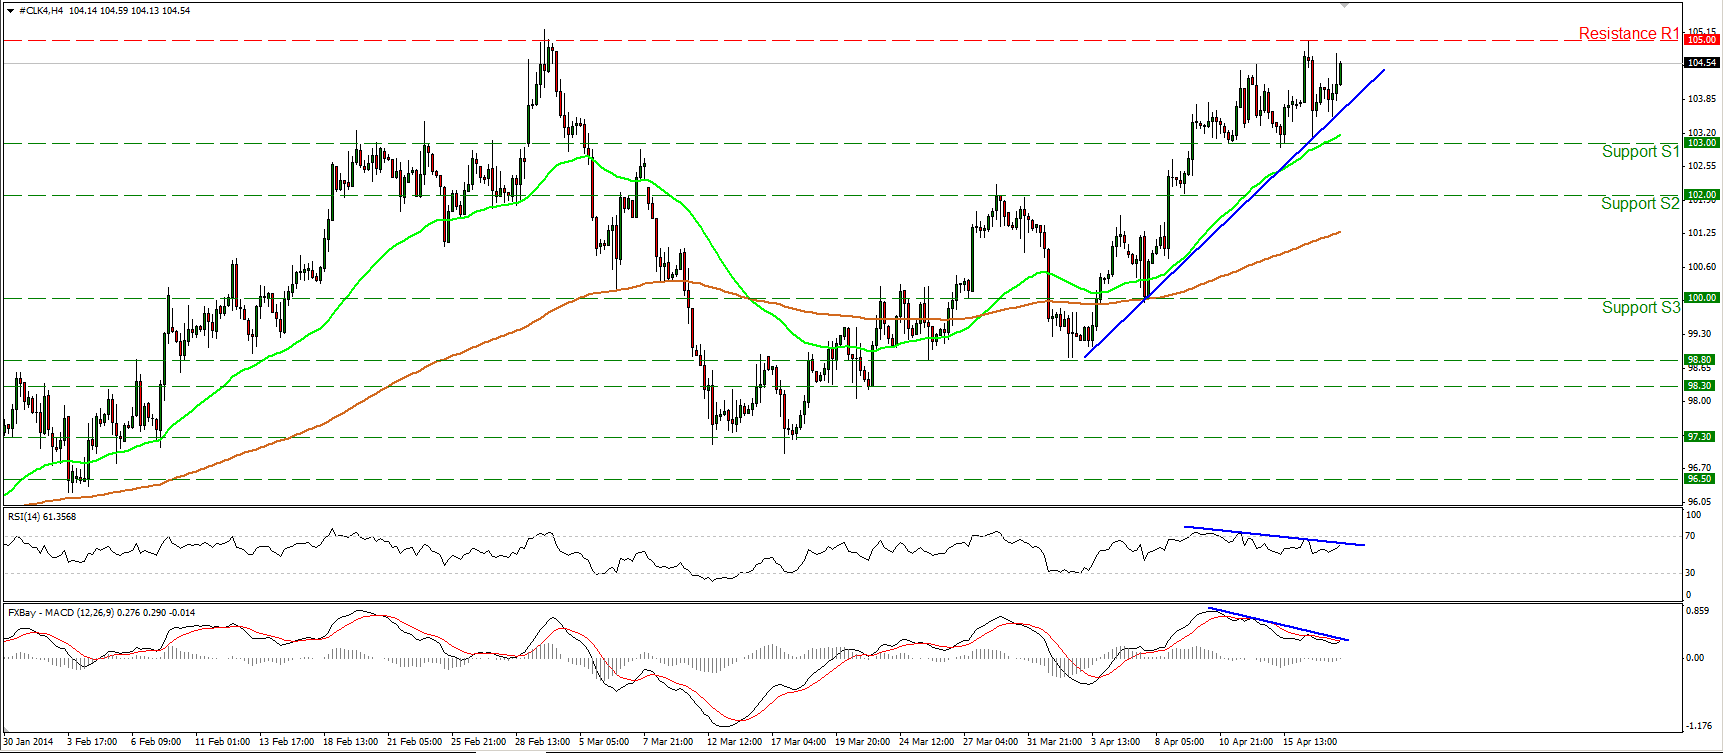
WTI moved higher after finding support near the blue uptrend line. The price is heading for another test at the 105.00 (R1) obstacle, where an upward violation may have larger bullish implications and target the 108.00 (R2) area. As long as WTI is printing higher highs and higher lows above the blue uptrend line and above both the moving averages, I consider the short-term uptrend to remain intact. However, the negative divergence between both our momentum studies and the price action remains in effect, indicating decelerating upside momentum. A move below 103.00 (S1) would confirm the divergence and may target the 102.00 (S2) bar.
Support: 103.00 (S1), 102.00 (S2), 100.00 (S3).
Resistance: 105.00 (R1), 108.00 (R2), 110.00 (R3).
Recommended Content
Editors’ Picks
AUD/USD failed just ahead of the 200-day SMA

Finally, AUD/USD managed to break above the 0.6500 barrier on Wednesday, extending the weekly recovery, although its advance faltered just ahead of the 0.6530 region, where the key 200-day SMA sits.
EUR/USD met some decent resistance above 1.0700

EUR/USD remained unable to gather extra upside traction and surpass the 1.0700 hurdle in a convincing fashion on Wednesday, instead giving away part of the weekly gains against the backdrop of a decent bounce in the Dollar.
Gold stays firm amid higher US yields as traders await US GDP data

Gold recovers from recent losses, buoyed by market interest despite a stronger US Dollar and higher US Treasury yields. De-escalation of Middle East tensions contributed to increased market stability, denting the appetite for Gold buying.
Ethereum suffers slight pullback, Hong Kong spot ETH ETFs to begin trading on April 30

Ethereum suffered a brief decline on Wednesday afternoon despite increased accumulation from whales. This follows Ethereum restaking protocol Renzo restaked ETH crashing from its 1:1 peg with ETH and increased activities surrounding spot Ethereum ETFs.
Dow Jones Industrial Average hesitates on Wednesday as markets wait for key US data

The DJIA stumbled on Wednesday, falling from recent highs near 38,550.00 as investors ease off of Tuesday’s risk appetite. The index recovered as US data continues to vex financial markets that remain overwhelmingly focused on rate cuts from the US Fed.
