Rising supply a headwind for Brent crude price
Brent crude price has been declining on continued excess of supply over global demand. Will the price resume advancing?
Brent crude oil price has been rebounding after hitting multi-year low in January. It has gained more than 68% since. However the rebalancing of global oil market has not proceeded at a pace initially hoped for as global supply still outstrips demand. Last week reports from the Organization of the Petroleum Exporting Countries, the Paris-based International Energy Agency and the US Energy Information confirmed the continuing oversupply of crude. The news last week that Nigeria and Libya are planning to increase oil exports was additional bearish factor for oil prices. Royal Dutch Shell and Exxon Mobil announced they have resumed Nigerian exports after militants had caused the shut-in of supply. Libya is also planning to resume exports from its Ras Lanuf port. The increased exports could result in additional supply of 1 million barrel per day, pressuring oil prices.

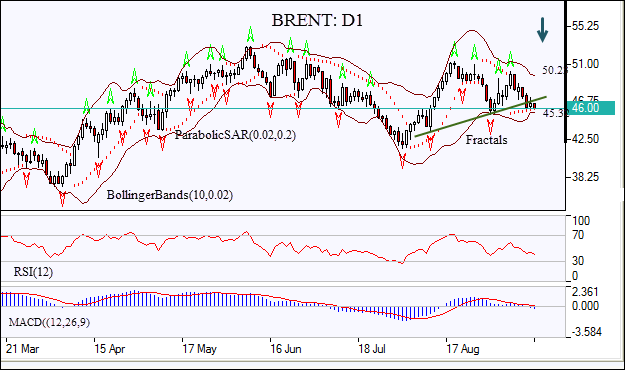
On the daily chart the BRENT: D1 has been retracing after rebounding to one-and-half month high in mid-August.
The price has fallen below the neckline of a head-and-shoulders pattern, which is a bearish signal.
The Parabolic indicator gives a buy signal.
The Bollinger bands have narrowed, indicating decreasing volatility.
The RSI oscillator is falling but hasn’t reached the oversold zone yet.
The MACD indicator is below the signal line and the gap is rising which is also a bearish signal.
We expect the bearish momentum will continue after the price breaches below last fractal low at 45.32. This level can be used as an entry point for a pending order to sell. The stop loss can be placed above the last fractal high at 50.23. After placing the pending order, the stop loss is to be moved to the next fractal low, following Parabolic signals. By doing so, we are changing the probable profit/loss ratio to the breakeven point. The most risk-averse traders may switch to the 4-hour chart after the trade and place there a stop-loss moving it in the direction of the trade. If the price meets the stop loss level (50.23) without reaching the order (45.23), we recommend canceling the position: the market sustains internal changes which were not taken into account.
Technical Analysis Summary
Position Sell
Sell stop Below 45.23
Stop loss Above 50.23
This overview has an informative character and is not financial advice or a recommendation. IFCMarkets. Corp. under any circumstances is not liable for any action taken by someone else after reading this article.
Recommended Content
Editors’ Picks
EUR/USD regains traction, recovers above 1.0700

EUR/USD regained its traction and turned positive on the day above 1.0700 in the American session. The US Dollar struggles to preserve its strength after the data from the US showed that the economy grew at a softer pace than expected in Q1.
GBP/USD returns to 1.2500 area in volatile session

GBP/USD reversed its direction and recovered to 1.2500 after falling to the 1.2450 area earlier in the day. Although markets remain risk-averse, the US Dollar struggles to find demand following the disappointing GDP data.
Gold climbs above $2,340 following earlier drop

Gold fell below $2,320 in the early American session as US yields shot higher after the data showed a significant increase in the US GDP price deflator in Q1. With safe-haven flows dominating the markets, however, XAU/USD reversed its direction and rose above $2,340.
XRP extends its decline, crypto experts comment on Ripple stablecoin and benefits for XRP Ledger

Ripple extends decline to $0.52 on Thursday, wipes out weekly gains. Crypto expert asks Ripple CTO how the stablecoin will benefit the XRP Ledger and native token XRP.
After the US close, it’s the Tokyo CPI

After the US close, it’s the Tokyo CPI, a reliable indicator of the national number and then the BoJ policy announcement. Tokyo CPI ex food and energy in Japan was a rise to 2.90% in March from 2.50%.