Today we consider the currency index &VSUSD_Index, composed by the Personal Composite Instruments - PCI technology. The index is designed to show the US dollar price movement against other segment of the Forex market. Acting as a systematic indicator of the FX market, we use a portfolio of the most liquid currencies:
EUR(12.7%)+JPY(14.5%)+GBP(17.5%)+CHF(19.1%)+AUD(18.1%)+CAD(18.1%). The price of each currency in the portfolio is expressed in USD. The weights are determined on the basis of the currency liquidity against the volume of international bank circulation.
Note that the index reaction to the fundamental events of the US economy is very obvious and stable: the index forms a stable trend channel, while it is less susceptible to the fundamental events of other currencies. Let us remind you that on Wednesday the Federal Open Market Committee (FOMC) issued the statement, confirming the QE3 completion in late October. This decision will result in a gradual volume reduction of the long-term government bonds purchases. However, the interest rates are planned to be kept at the level of 0-0.25% per annum in order to maintain the economic growth with the help of available commercial loans. The FOMC statement resulted in significant dollar consolidation against the most liquid currencies. This fact allows counting on the D1 bearish trend continuation of the &VSUSD_Index.
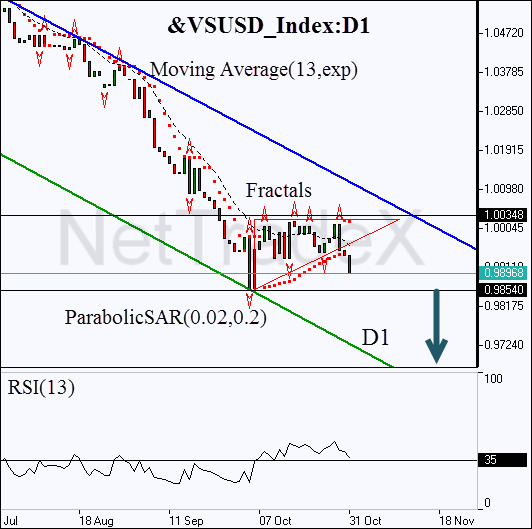
Here we consider the daily closing/opening price chart of the given instrument. It was composed in NetTradeX platform. We can see that the price broke the lower triangle side downwards. This is the first signal of the bearish trend continuation. At the same time we can see the downward intersection of the exponential moving average (13 days) and Parabolic reversal: all the major signals confirming the trend continuation. However, we should mention a stable momentum if the channel of the triangle is broken in the direction of the red zone, crossing the mark of 0.98540. In this case we expect the resistance level breakout of the RSI(13) oscillator at 35%. This price level can be used for placing a pending sell order. Stop Loss is recommended to be placed above the upper side of the triangle.
Position Sell
Sell stop below 0.98540
Stop loss above 1.00348
EUR(12.7%)+JPY(14.5%)+GBP(17.5%)+CHF(19.1%)+AUD(18.1%)+CAD(18.1%). The price of each currency in the portfolio is expressed in USD. The weights are determined on the basis of the currency liquidity against the volume of international bank circulation.
Note that the index reaction to the fundamental events of the US economy is very obvious and stable: the index forms a stable trend channel, while it is less susceptible to the fundamental events of other currencies. Let us remind you that on Wednesday the Federal Open Market Committee (FOMC) issued the statement, confirming the QE3 completion in late October. This decision will result in a gradual volume reduction of the long-term government bonds purchases. However, the interest rates are planned to be kept at the level of 0-0.25% per annum in order to maintain the economic growth with the help of available commercial loans. The FOMC statement resulted in significant dollar consolidation against the most liquid currencies. This fact allows counting on the D1 bearish trend continuation of the &VSUSD_Index.
Here we consider the daily closing/opening price chart of the given instrument. It was composed in NetTradeX platform. We can see that the price broke the lower triangle side downwards. This is the first signal of the bearish trend continuation. At the same time we can see the downward intersection of the exponential moving average (13 days) and Parabolic reversal: all the major signals confirming the trend continuation. However, we should mention a stable momentum if the channel of the triangle is broken in the direction of the red zone, crossing the mark of 0.98540. In this case we expect the resistance level breakout of the RSI(13) oscillator at 35%. This price level can be used for placing a pending sell order. Stop Loss is recommended to be placed above the upper side of the triangle.
Position Sell
Sell stop below 0.98540
Stop loss above 1.00348
Recommended Content
Editors’ Picks
EUR/USD clings to daily gains above 1.0650

EUR/USD gained traction and turned positive on the day above 1.0650. The improvement seen in risk mood following the earlier flight to safety weighs on the US Dollar ahead of the weekend and helps the pair push higher.
GBP/USD recovers toward 1.2450 after UK Retail Sales data

GBP/USD reversed its direction and advanced to the 1.2450 area after touching a fresh multi-month low below 1.2400 in the Asian session. The positive shift seen in risk mood on easing fears over a deepening Iran-Israel conflict supports the pair.
Gold holds steady at around $2,380 following earlier spike

Gold stabilized near $2,380 after spiking above $2,400 with the immediate reaction to reports of Israel striking Iran. Meanwhile, the pullback seen in the US Treasury bond yields helps XAU/USD hold its ground.
Bitcoin Weekly Forecast: BTC post-halving rally could be partially priced in Premium

Bitcoin price shows no signs of directional bias while it holds above $60,000. The fourth BTC halving is partially priced in, according to Deutsche Bank’s research.
Week ahead – US GDP and BoJ decision on top of next week’s agenda

US GDP, core PCE and PMIs the next tests for the Dollar. Investors await BoJ for guidance about next rate hike. EU and UK PMIs, as well as Australian CPIs also on tap.